Blog

  • YouTube Just Raised the Bar for Partner Program Eligibility, What It Means for Your Monetization Plan

    YouTube Just Raised the Bar for Partner Program Eligibility, What It Means for Your Monetization Plan

    On August 10, 2026, YouTube rewrote one of the most consequential rulebooks in the creator economy. If you run a solo channel or a two person operation and you have not yet joined the YouTube Partner Program, the finish line just moved further away. If you are already inside the program, a new activity test means membership is no longer something you earn once and keep forever without effort.

    This is not a small policy tweak buried in a support article nobody reads. It is the first major overhaul of Partner Program entry standards since 2018, and it lands at a moment when the gap between creators who earn real money on YouTube and everyone else has never been wider.

    This article breaks down exactly what changed, why YouTube made the move now, who it actually affects, and how to check where your channel stands today instead of finding out the hard way next February.

    8,000 hrs
    New watch hour requirement, up from 4,000
    TechCrunch, August 10, 2026
    20M views
    New Shorts view requirement, up from 10M
    TechCrunch, August 10, 2026
    10M / 90 days
    Rolling Shorts floor to keep Shorts revenue active
    Digital Music News, August 10, 2026

    What Actually Changed on August 10

    YouTube announced on August 10 that it is doubling the entry requirements for new applicants to the Partner Program. Right now, a channel can qualify with 1,000 subscribers plus either 4,000 watch hours earned over the past year or 10 million qualified Shorts views collected in the last 90 days. Starting February 1, 2027, new applicants will need 8,000 watch hours or 20 million Shorts views instead. That is a straight doubling of the long form watch time bar, and it is the biggest single change to entry standards the program has seen in nearly a decade.

    The subscriber requirement itself has not moved. A channel still needs 1,000 subscribers to apply. What changed is everything sitting behind that number, the actual proof of sustained viewership YouTube wants to see before it starts sharing ad revenue with a new creator.

    Two smaller changes traveled alongside the headline number, and both matter more than they got credit for in the initial coverage.

    The New Watch Hour and Shorts View Thresholds

    RequirementBefore Feb 1, 2027Starting Feb 1, 2027
    Subscribers1,0001,000 (unchanged)
    Long form watch hours4,000 hrs / 365 days8,000 hrs / 365 days
    Shorts views10,000,000 / 90 days20,000,000 / 90 days
    Ongoing Shorts floorNone10,000,000 every 90 days

    The table above tells the surface level story. The real story is what happens after a creator clears that bar, because clearing it once is no longer the finish line it used to be.

    The Rolling Shorts Floor Nobody Is Talking About

    Buried underneath the headline number is a second change that matters just as much for anyone building a channel around short form video. Once a Shorts creator qualifies for the program, they now have to keep clearing 10 million Shorts views every single 90 day window or their Shorts revenue switches off. This is not a one time bar to clear on the way in. It is a bar a creator has to keep clearing, quarter after quarter, for as long as Shorts income matters to that channel.

    That rolling requirement turns monetization from a milestone into an ongoing performance obligation. A strong quarter followed by a slow one is no longer just a dip in the numbers. It can mean the difference between a channel that earns and a channel that temporarily does not.

    The New Activity Test for Existing Creators

    YouTube also introduced an activity test that applies to creators who are already inside the Partner Program, not just new applicants. The exact mechanics of how the test is scored have not been fully detailed publicly, but the intent behind it is clear enough. A channel that goes quiet for months at a time can no longer assume its monetization status is locked in simply because it qualified once, years ago.

    For creators who built a channel, monetized it, and then slowed down for personal reasons or a career pivot, this is the change most worth paying attention to. Past performance no longer guarantees current standing.

    Why YouTube Is Raising the Bar Now

    YouTube did not make this change in a vacuum. The platform now supports more than 2 million creators inside the Partner Program and over 2.7 billion monthly active users watching video, and every one of those creators is competing for a finite pool of advertising budget. Raising the entry bar is YouTube’s way of protecting ad quality and pushing out low effort, spam adjacent channels that were diluting the pool without adding much value for advertisers or for viewers scrolling through recommendations.

    It also fits a broader pattern showing up across platforms this year. Algorithms and monetization programs increasingly reward consistency and depth over raw volume, a shift Bluekona has tracked closely in how brands and creators are scaling strategy with AI rather than simply publishing more. YouTube is not just asking creators to make more content. It is asking them to prove that content actually holds an audience’s attention long enough to matter.

    Who This Actually Affects (and Who It Doesn’t)

    Not every creator needs to panic about this change, and not every creator can safely ignore it either. The impact splits along three fairly clear lines, and knowing which one describes your channel changes what you should actually do between now and February.

    Creators Applying After February 1, 2027

    If a channel has not yet joined the Partner Program and is not on track to apply before February 1, 2027, the new thresholds are the ones that apply. That means treating 8,000 watch hours or 20 million Shorts views as the real target from today forward, not the old 4,000 hour benchmark still floating around in outdated guides and forum threads.

    Existing YPP Members Facing the Activity Test

    Creators already inside the program do not need to hit the new entry thresholds again. The activity test is the piece that applies to this group, and it rewards channels that keep publishing and holding an audience over channels that monetized once and went dormant.

    Shorts First Creators vs Long Form Creators

    Shorts first creators face the sharpest change because of the rolling 90 day floor. Long form creators face a steeper one time climb to 8,000 watch hours but no equivalent rolling requirement once they qualify. Channels that mix both formats sit in the more resilient position, since a slow quarter in one format does not immediately threaten monetization in the other.

    More Resilient Position
    • Channels mixing long form and Shorts content
    • Creators running three or more revenue streams
    • Channels publishing consistently, even at a modest pace
    More Exposed Position
    • Shorts only channels sitting close to the 90 day floor
    • Creators relying entirely on YPP ad revenue
    • Dormant channels that monetized years ago and stopped posting

    The Real Risk Isn’t the Threshold, It’s Not Knowing Where You Stand

    Here is the uncomfortable number underneath all of this. Just 3 percent of YouTubers earn 90 percent of the money paid out on the platform, and the top 1 percent of creators take home 21 percent of all creator payments, according to 2026 creator economy research. Half of all creators earn under 15,000 dollars a year. Those numbers were true before August 10. The new thresholds do not create that inequality, they just make it a little harder to close the gap without a deliberate plan.

    The creators who get caught off guard by a rule change like this one are rarely the ones who are actually behind on watch hours or Shorts views. They are the ones who never checked their own numbers until a deadline forced them to look. YouTube Studio shows the raw data, but it does not translate that data into a clear answer to the one question that matters, whether a channel is on pace to clear the new bar or falling short of it.

    That translation gap is exactly where a proper audit earns its keep.

    The February 2027 Deadline

    New applicant thresholds take effect February 1, 2027. Existing creators are not required to reclear the entry bar, but the new activity test is being tracked now, not starting on the deadline itself, so waiting until January to check your standing skips months of runway you could be using today.

    How to Audit Your Channel Against the New Bar

    Checking where a channel actually stands does not require guesswork or a spreadsheet built from scratch. A focused audit answers four questions in one pass.

    First, current watch hours over the trailing 365 days, measured against the new 8,000 hour target rather than the old 4,000 hour one. Second, Shorts view volume over the trailing 90 days, since that is the rolling window that now determines ongoing Shorts eligibility, not a lifetime total. Third, publishing activity over the past two to three months, since the new activity test rewards channels that keep showing up. Fourth, which specific videos or Shorts are driving the bulk of watch time, because a channel sitting close to the new threshold often just needs to double down on the two or three formats already working rather than starting from scratch.

    Our step by step guide to auditing a YouTube channel walks through the manual version of this process in detail. Bluekona’s cross platform audit automates the same analysis, pulling watch hours, Shorts performance, and publishing consistency into one clear readout instead of four separate exports from YouTube Studio.

    Most creators can recite their sub count from memory and could not tell you their watch hours if you paid them. That is the actual problem here.

    Delphi, Bluekona AI mascot

    Turning a Deadline Into a Diversification Push

    A rule change like this is a good moment to ask a bigger question than just whether a channel clears the bar. Betting an entire income plan on a single platform’s revenue share program has always been fragile. The new thresholds just made that fragility a little more visible.

    Creators running three or more revenue streams earned 75,000 dollars more on average in 2025 than creators relying on a single source, according to the same creator economy research cited earlier. Affiliate revenue, product tagging, sponsorships, and repurposed content distributed across other platforms all count as separate streams, and none of them depend on clearing YouTube’s watch hour bar.

    This is also where a channel’s back catalog becomes an asset instead of dead weight. Older videos sitting untouched for a year or more are not just missed watch hours, they are missed opportunities to add product tags, refresh calls to action, or repurpose the strongest moments into Shorts that feed the new rolling floor. Our guide on measuring the ROI of content repurposing covers how to find which older videos are worth that kind of second pass, rather than repurposing everything indiscriminately and hoping something sticks.

    A Monetization Readiness Checklist Before February 2027

    None of this requires a full strategy overhaul before next week. It requires an honest look at four numbers and a plan for whichever ones are lagging. The table below is a simple way one creator might track that ahead of the new thresholds taking effect, with example statuses shown for illustration.

    MetricTargetWhere to Check ItExample Status
    Long form watch hours (365 days)8,000 hoursYouTube Studio, Analytics tabWatch
    Shorts views (90 days)20,000,000 viewsYouTube Studio, Content tabOn Track
    Rolling Shorts floor (90 days)10,000,000 viewsYouTube Studio, Content tabAt Risk
    Publishing activity (60 days)Consistent uploadsChannel upload historyOn Track

    February 2027 feels far away until it is not. The creators who come out ahead of this change will not be the ones who panic in January. They will be the ones who ran the numbers in August, found the gaps early, and used the months in between to close them, whether that means pushing watch hours, tightening Shorts consistency, or finally building a second revenue stream that does not depend on a single platform’s rulebook.

    A cross platform audit is the fastest way to see exactly where a channel stands against every one of these numbers today, not in February when the deadline is no longer a warning.

    See where your channel stands before February 2027

    Run a free cross platform audit and get a clear read on watch hours, Shorts performance, and publishing consistency in minutes.

    Run a Free Audit
  • How Multi-Channel Agencies Can Track Monetization Across Every Client Account Without a Spreadsheet

    How Multi-Channel Agencies Can Track Monetization Across Every Client Account Without a Spreadsheet

    A creator agency wraps up a monthly report for a client. It has reach, impressions, engagement rate, maybe a screenshot of a viral Reel. What it does not have is a single number showing how much revenue that content actually generated. That gap is the real problem multi-channel agencies run into once they scale past a handful of accounts.

    Managing five to ten client accounts across YouTube, Instagram, TikTok, Facebook, and Threads used to mean five to ten spreadsheets. Now it usually means five to ten different affiliate dashboards, five to ten browser tabs open at once, and one exhausted account manager trying to reconcile all of it before the client call. Something has to give, and it should not be accuracy.

    Three numbers explain why this matters more in 2026 than it did even a year ago.

    47%
    YoY growth in creator affiliate revenue in 2026
    Digital Applied, 2026
    64%
    Of marketers now manage three or more social accounts
    HubSpot, via Planable 2026
    53%
    Of agency SaaS licenses go unused or underused
    Productiv, 2025 State of SaaS

    Affiliate revenue for creators is growing fast, more marketers are juggling more accounts than ever, and agencies are quietly paying for tools they barely open. Put those three trends together and the agencies that get monetization tracking right this year have a real edge over the ones still exporting numbers into a spreadsheet by hand.

    Why spreadsheets break down past 5 client accounts

    A spreadsheet works fine when an agency runs one or two client accounts on a single platform. Someone updates a tab once a week, engagement numbers get copied in, and the report goes out on time. That system falls apart the moment a third or fourth client signs on, especially once those clients start running video content across multiple platforms with their own product tagging and affiliate structures. Each new platform adds another login, another export, and another format that never quite matches the last one.

    The manual affiliate link tracking problem

    Every platform handles product tagging and affiliate links differently. YouTube has its shopping features, Instagram has shopping tags, TikTok runs its own creator marketplace links, and Threads is still catching up. An account manager copying clicks and conversions into a spreadsheet for every client every week is not really tracking performance, they are doing manual data entry. Data entry has a habit of falling behind the exact week a client launches a big campaign, which is usually the week accurate numbers matter most.

    Delphi, Bluekona AI mascot

    Losing a fish is bad. Losing your best affiliate link somewhere in row 400 of a spreadsheet is worse. At least the fish had an excuse.

    Reporting turns into a research project instead of a summary

    When a client asks which video actually sold the most product, the honest answer from most agencies is that they will get back to them. That delay is often the moment agencies start losing retainers, because the client starts wondering what exactly they are paying a management fee for. A report full of reach and engagement numbers does not answer the one question every client actually cares about, which content made them money.

    What agencies actually need to track across accounts

    Product and affiliate tagging by platform

    Tracking monetization properly means knowing which products and affiliate links live inside which piece of content, on which platform, for which client. That sounds simple until an agency is running fifteen accounts with new videos and posts going up daily. Auto detecting and tagging products inside video and social content removes the need for anyone to manually log a link every time a client publishes something new. Agencies that already run a full social media audit across a client’s channels have a natural starting point for this, since the audit already surfaces every piece of content worth tagging.

    Revenue attribution, not just engagement

    Engagement tells an agency what people noticed. Revenue tells an agency what people bought. Those are different numbers, and most reporting tools still stop at the first one. Attribution matters more as clients get more sophisticated about what they expect from a management fee. A brand paying for content across five creators wants to know which creator, which video, and which platform actually drove sales, not just which post got the most likes.

    The metric that actually matters

    An agency that can only report what people noticed is one tool refresh away from being replaced by an agency that can report what people bought.

    Repurposing performance across channels

    Multi-channel agencies live and die by repurposing, since the same piece of content usually gets cut into a YouTube video, a handful of Reels, a few TikToks, and a Threads post. Tracking that content correctly means following performance and revenue through every one of those versions, not just the original upload. Agencies already measuring the ROI of content repurposing have a head start here, because the same infrastructure that tracks repurposing performance can track monetization performance too.

    The real cost of tool sprawl for agencies

    Agencies rarely set out to build a messy tool stack. It happens one client at a time, one platform at a time, until a five person team is paying for a dozen different logins that barely talk to each other. The average company now runs over a hundred SaaS applications, and more than half of the licenses paid for go unused or underused. Agencies feel this acutely, because every new platform a client wants covered tends to come with its own dashboard, its own login, and its own export format that never quite matches the spreadsheet everyone else is using.

    Paying for ten tools so you never have to look at one dashboard is not a strategy. It is a subscription hobby.

    Delphi, Bluekona AI mascot

    Spreadsheet reporting

    • Updated by hand once a week at best
    • Breaks the moment a client adds a new platform
    • Shows engagement, rarely shows revenue
    • Takes hours to rebuild before every client call

    Centralized monetization reporting

    • Updates automatically as new content goes live
    • Scales to new platforms without a new tab
    • Shows which content actually converted
    • Ready to present the moment the call starts

    What a centralized monetization view looks like instead

    One audit across every platform

    Instead of running a separate check on each platform, a single content performance audit across YouTube, Instagram, Facebook, and Threads gives an agency one place to see what is actually working for a client. That single view also makes it possible to spot patterns across platforms, like a product that performs well on YouTube but has never been tagged anywhere in the client’s Instagram content at all.

    Auto-tagged products and affiliate links per client

    Once products and affiliate links get tagged automatically across a client’s content library, an agency stops relying on someone remembering to log every link by hand. This is also where a resource like the affiliate marketing glossary breakdown comes in handy for onboarding new account managers who need a fast refresher on how affiliate revenue actually works before they start reading client data.

    Client-ready reporting in one place

    The real payoff shows up in the client meeting. Instead of stitching together numbers from five different sources the night before a call, an account manager can pull a report that already shows revenue by content, by platform, and by client. Agencies that have made this shift are the ones showing up in conversations about how AI audits help agencies win and retain clients, because a revenue-first report is a much harder thing for a client to walk away from.

    What needs tracking Manual spreadsheet Centralized monetization view
    Affiliate link clicks Manual Automated
    Revenue attributed to specific content Manual Automated
    Cross platform performance comparison Partial Automated
    Client-ready reporting Manual Automated

    Moving from spreadsheet chaos to a monetization system

    Making this shift does not require ripping out an agency’s entire workflow overnight. It usually happens in a few clear steps.

    1. Run a full audit across every client account on every platform they use, so the agency has one accurate baseline instead of five different spreadsheets each claiming to be accurate.
    2. Identify which pieces of content already have products or affiliate links attached, and which ones are missing tags entirely.
    3. Set up automatic tagging going forward so no new piece of content depends on someone remembering to log a link.
    4. Build client reports around revenue and attribution first, with engagement metrics as supporting context rather than the headline.
    5. Retire the spreadsheets once the new system has run long enough to earn everyone’s trust, not before.

    Agencies that have already started consolidating their AI marketing tools tend to find this transition easier, since replacing five disconnected logins with one monetization view is really just tool consolidation applied to reporting specificall

    Delphi, Bluekona AI mascot

    You do not need more spreadsheets. You need one place that already knows what sold. Go run the audit and let the data do the swimming for you.

    None of this requires an agency to become a data science team. It requires one system that already knows what a client’s content earned, so the team can spend its time acting on that information instead of assembling it by hand every month. The agencies that make this shift first will be the ones renewing retainers while everyone else is still rebuilding last month’s spreadsheet.

    See what your client accounts are actually earning

    Run a full content performance audit across every platform your clients use, and find the revenue that spreadsheets have been missing.

  • What Is Content-to-Revenue Attribution? A Guide for DTC Marketing Teams

    What Is Content-to-Revenue Attribution? A Guide for DTC Marketing Teams

    Your last video hit record views. Comments are up. The engagement graph in your dashboard is trending the right direction. Then someone on the leadership team asks the one question that actually matters. Which piece of content drove revenue this month? The room goes quiet.

    This is the exact moment where most DTC and e-commerce marketing teams run into a wall. They have plenty of data on what people watched, liked, and shared. What they do not have is a clear line from a specific piece of content to a specific dollar in the bank. That line is what content-to-revenue attribution is built to draw.

    This guide breaks down what content-to-revenue attribution actually means, why the engagement metrics your team already tracks will not get you there, and how to set up a realistic attribution process even without a dedicated analyst or a six-figure martech stack. Along the way, it walks through a real worked example showing how one video’s viewers turn into tracked revenue, and the exact spots where even a well-built attribution setup tends to break down.

    What Content-to-Revenue Attribution Actually Means

    Content-to-revenue attribution is the practice of connecting a specific piece of content, a video, a post, a product placement, directly to the sales it produces. Instead of asking how a post performed, the question becomes how much revenue can be traced back to that exact post.

    That distinction sounds small, but it changes almost everything about how a marketing team plans its calendar, briefs its creators, and defends its budget. A brand that only tracks engagement can say which posts got attention. A brand that tracks content-to-revenue attribution can say which posts, formats, and creators are actually worth making more of.

    The mechanics are simpler than most teams expect. It starts with tagging the products or affiliate links inside a piece of content, so every click, view, and eventual purchase can be traced back to the content that produced it. From there, attribution connects that tagged interaction to an actual purchase event, whether that happens on the same platform or after a customer clicks through to your store. For a broader look at why proving content works is so hard in the first place, see the problem with social media metrics.

    It also helps to be honest about what attribution can and cannot prove. A well-tagged system can show that a specific video preceded a specific purchase. It cannot always show that the purchase would not have happened anyway, through a different channel, on a different day. That stronger claim, that the content actually caused the sale rather than just showing up somewhere in the path to it, is called incrementality, and it usually requires a holdout group or a controlled test rather than tagging alone. Attribution and incrementality answer different questions. Most DTC teams get the most value once they use attribution for everyday decisions about which content to make more of, and save incrementality testing for occasional checks on whether the whole system is adding new revenue rather than just reshuffling credit for sales that would have happened regardless.

    Why Engagement Metrics Keep Lying to Your Team

    Likes and Views Measure Attention, Not Intent

    Engagement metrics were built to measure whether people noticed your content, not whether they were persuaded by it. A video with a huge view count might be entertaining without moving a single unit. A post with modest reach but a highly relevant audience might quietly drive a disproportionate share of sales. Platform dashboards were not designed to tell those two situations apart, because they were built to keep viewers inside the platform, not to report what happened after someone left it.

    This is the trap DTC teams fall into constantly. A content calendar gets built around what performs well by the platform’s own terms, likes, shares, watch time, without ever checking whether any of it correlates with the numbers the business actually cares about, like new customer acquisition or repeat purchase rate.

    A meaningful chunk of buying behavior never shows up in any dashboard at all. A shopper watches a video, does not click anything, opens a new tab a day later, and searches the product by name instead. Someone else screenshots a product and texts it to a friend, who buys it a week later without ever seeing the original post. Marketers call this dark social, and it is one of the biggest reasons a genuinely persuasive piece of content can look like it drove almost nothing.

    The Gap Between Performing Well and Driving Sales

    Here is the uncomfortable part. Content can perform extremely well by every engagement measure and still contribute close to nothing to revenue. That gap is exactly why so many marketing teams struggle to defend their budgets to finance. It is hard to justify spend on a metric that leadership cannot tie to the P&L. Campaigns that connect content to actual purchase data see a 31.8 percent lower customer acquisition cost than campaigns judged on platform metrics alone, according to Admetrics’ 2026 cross-channel research, which is the kind of number that gets a CFO’s attention in a way an engagement report never will.

    Delphi, Bluekona AI mascot

    A million views and zero sales is not a content win. It is a very expensive way to entertain strangers.

    The Data Behind the Measurement Gap

    This is not a niche problem. Recent research shows just how wide the gap is between what content teams track and what they can actually prove to leadership.

    87%
    of content teams track traffic, but only 31% track revenue attribution
    Digital Applied, Content Marketing Statistics 2026 (Apr 2026)
    61%
    of marketers say they struggle to connect content metrics to revenue outcomes
    Digital Applied, Content Marketing Statistics 2026 (Apr 2026)
    3.1x
    higher budget growth for teams that can prove content ROI to leadership
    Digital Applied, Content Marketing Statistics 2026 (Apr 2026)

    The gap shows up in the customer journey too. Shoppers today typically need around 11 separate touchpoints before they buy, and brands with mature cross-channel measurement see roughly 3.2 times higher marketing-attributed revenue growth than brands still relying on single-channel reporting, according to Admetrics’ 2026 cross-channel marketing research. Teams that can prove content ROI get more budget the following year, while teams stuck reporting on engagement alone tend to have their spend questioned every quarter. The gap is not about effort. Most content teams already track plenty of numbers. The problem is that the numbers they track do not answer the question their CFO is actually asking.

    How Content-to-Revenue Attribution Actually Works

    Tagging Products and Links Inside Content

    Attribution starts at the content level, not the analytics level. Every product mentioned or shown in a video, every affiliate link dropped in a caption or description, needs a tag that survives the trip from the content to the checkout page. Without that tag, a sale that started with your content looks identical to a sale that started from a random search. For teams juggling product placements across dozens of videos and posts, doing this by hand in a spreadsheet is usually where things fall apart first. Automated product and affiliate link tagging exists specifically to close that gap, catching mentions and links inside content and tying them to a trackable identifier without someone combing through every video by hand.

    In practice, tagging happens through a mix of methods depending on the platform. Instagram and TikTok both support native shopping tags that attach a specific product straight to a post or video, no extra link required. YouTube offers a similar shopping shelf under long-form videos and Shorts. For platforms or creators without native shopping tools, affiliate links through networks like LTK, ShopMy, Amazon Associates, or a brand’s own affiliate program fill the gap, alongside plain UTM-tagged links dropped in captions, descriptions, and link-in-bio tools. None of these methods is complete on its own. A brand running content across four platforms with a handful of creators typically ends up combining two or three of them just to get reasonable coverage.

    Connecting That Tag to a Purchase Event

    Once a tag exists, a few things need to line up before a sale gets connected back to it. First, an attribution window. Most platforms and affiliate networks default to something like a one day view window and a seven day click window, meaning a purchase only counts if it happens within that stretch of time after the interaction, though some brands extend this to twenty eight days for higher consideration products. Second, an identifier that survives the trip from click to checkout, usually a cookie, a URL parameter, or a server-side event tied to the customer’s order. Third, a way to reconcile that identifier against the actual order in Shopify, WooCommerce, or whatever platform processes the sale. A tagging system that works on one video but breaks on the next post leaves gaps in the data that make trend analysis nearly impossible, and an attribution window that runs too short will systematically undercount slower-consideration purchases, like a $200 skincare bundle, compared to a $15 impulse buy.

    Where Attribution Breaks Down

    Even a well-built system has real limits, and it helps to know them going in. Platforms are walled gardens, so a creator’s Reel that gets watched, screenshotted, and then converts through a Google search two days later shows up as organic search revenue, not content revenue, even though the video did the actual persuading. Cross-device journeys cause a similar problem. Someone watches a video on a phone during a commute and buys later from a laptop, and unless a brand has strong cross-device identity matching, that purchase looks disconnected from the content that triggered it. Privacy changes on iOS and growing cookie restrictions have made this harder over the past few years, which is part of why 78 percent of e-commerce companies had already moved to server-side tracking by 2025, since server-side events survive browser-level blocking that pixel-only tracking does not.

    Attribution Models in Plain Terms

    Once tracking data exists, a team still has to decide how credit gets assigned when a customer interacts with more than one piece of content before buying. Three basic models handle most of this work.

    Model How It Works Best For Setup Effort
    First Touch All the credit goes to the first piece of content a customer interacted with Short consideration windows, awareness-focused campaigns Moderate
    Last Touch All the credit goes to the final piece of content before purchase Teams just starting attribution Low Effort
    Multi Touch Credit is split across every piece of content in the path to purchase Longer, multi-platform customer journeys Higher Effort
    Position-Based Splits credit between the first and last touch, with a smaller share for everything in between Brands with strong content at both the discovery and conversion stages Higher Effort

    Most DTC teams start with last touch because it is the simplest to set up, then move to multi touch or position-based once they have enough volume to make the added complexity worth it. There is no universally correct choice here. The right model depends on how long a customer journey typically runs and how many pieces of content a buyer usually sees before converting, and with the average shopper now needing around 11 touchpoints before buying, last touch alone increasingly hides more than it reveals.

    Picking an attribution model is like picking a diet. The best one is the one your team will actually stick with past week two.

    Delphi, Bluekona AI mascot

    A Worked Example, Tracing One Video to Actual Revenue

    Numbers make this concrete faster than definitions do. Picture a skincare brand publishing two Instagram Reels in the same week, each tagging the same $58 serum.

    Reel A is a fast-paced trend format. It pulls 210,000 views, 3,400 profile visits, and a respectable 68,000 likes. The product tag gets 1,900 clicks. Of those clicks, 22 turn into purchases inside the seven day attribution window, for $1,276 in tracked revenue.

    Reel B is a slower, more explanatory video showing exactly how the serum fits into a routine. It pulls only 38,000 views, a fraction of Reel A’s reach. But the product tag gets 2,600 clicks, a much higher share of a smaller audience, and 94 of those clicks convert, for $5,452 in tracked revenue.

    Metric Reel A Reel B
    Views 210,000 38,000
    Product Tag Clicks 1,900 2,600
    Purchases 22 94
    Attributed Revenue $1,276 $5,452
    Revenue per 1,000 Views $6.08 $143.47

    Judged on views alone, Reel A looks like the clear winner, more than five times the reach. Judged on attributed revenue, Reel B outperforms it by roughly four times, off a fraction of the audience. A content calendar built around view counts would greenlight ten more videos like Reel A. A content calendar built around attribution data would greenlight ten more videos like Reel B, and would likely hand that creator a bigger share of next quarter’s product seeding budget.

    This is a simplified example, but the pattern shows up constantly in real audits. A video that looked unremarkable in the engagement tab is often quietly outperforming everything else once tagged product data gets layered on top, which is exactly the kind of signal the recognition between content and conversion is built to surface.

    A Realistic Attribution Setup for a Lean DTC Team

    What You Can Track Manually, and Where It Breaks Down

    A small team with one or two people handling content can track attribution manually for a while. UTM links in every caption, a shared spreadsheet logging which video promoted which product, a manual pull from the store’s backend each week to cross-reference sales against click data. This holds up reasonably well for a single creator posting on one or two platforms. It typically starts breaking down somewhere around three to four active creators across more than two platforms, which is exactly when the spreadsheet turns into a part-time job nobody signed up for, someone is manually copying click counts from five different dashboards into one tab, catching typos in product codes, and still missing purchases that happened outside the tracked window. This is the exact wall covered in tracking content performance across platforms without a spreadsheet or analyst, and it is the point where most teams either hire an analyst they cannot afford yet or quietly give up on attribution altogether.

    What an Automated Audit Handles for You

    Quick Takeaway

    A content performance audit does the matching work automatically, tying every tagged product or link back to the video or post that produced it, so a team spends time acting on the data instead of assembling it.

    This is where a platform like Bluekona changes the math. Instead of manually reconciling data across YouTube, Instagram, Facebook, and Threads, an automated audit pulls performance and tagged product data into one place, so a marketing manager can see which specific pieces of content are actually contributing to sales without opening five different dashboards. That view is exactly what closes the gap between content and conversion that most engagement-only reporting misses entirely.

    Good Attribution Habits vs Bad Ones

    Works Well

    Tagging Every Product Before Publishing

    Every video and post gets a trackable tag the moment it goes live, so no sale gets lost in the gap between content and checkout.

    Falls Short

    Tagging Products After the Fact

    Waiting until a video already went viral to add tracking links, which means the biggest wins in the dataset are the ones missing the most data.

    Turning Attribution Data Into Content Decisions

    Attribution only pays off once it changes what a team makes next. In practice, this usually plays out as a simple ranking exercise, run monthly rather than after every single post. Pull every piece of tagged content from the past 30 days, sort by attributed revenue instead of views or engagement rate, and look closely at the top and bottom quartiles. The top quartile usually shares something in common, a specific creator, a specific format, a specific way of showing the product in use, and that pattern becomes the actual brief for next month’s content, not a hunch about what felt like it was trending.

    If a certain creator’s product placements consistently outperform on revenue per view, that is a signal to give them a bigger share of the content calendar, not just a bigger comment count. If a format that gets huge engagement never converts, that is useful information too. It might still be worth keeping for brand awareness, but it should not be graded on the same scale as content built to sell.

    Repurposing plays into this as well. A piece of content that already proved it drives revenue is a much safer bet to repurpose across formats than one that simply went viral. Bluekona’s own research on measuring the ROI of content repurposing found that content with a proven conversion history tends to perform better when reformatted than content chosen purely because it got attention the first time around.

    Delphi, Bluekona AI mascot

    Stop repurposing whatever went viral last week and start repurposing whatever actually sold something. Your calendar will thank you.

    Over time, this turns content planning from a guessing game into a feedback loop. Every piece of content becomes a data point that tells a team what to make more of and what to quietly retire, which is a very different starting position than rebuilding the plan from scratch every planning cycle.

    Frequently Asked Questions

    Is content-to-revenue attribution only possible with a big martech budget?

    No. The core requirement is consistent tagging, not expensive software. Small teams can start with UTM links and spreadsheets, though that approach gets harder to maintain as content volume grows across multiple platforms and creators.

    What is the difference between content-to-revenue attribution and affiliate tracking?

    Affiliate tracking is one input into attribution. It shows that a sale came through a specific link. Content-to-revenue attribution goes a step further, connecting that sale back to the specific video, post, or creator that produced the link in the first place.

    How long does it take to see reliable attribution data?

    Most teams need at least four to six weeks of consistent tagging and tracking before patterns become reliable enough to act on. Shorter windows tend to get skewed by a single high-performing post or a slow sales week.

    Should every piece of content be judged by revenue attribution?

    Not necessarily. Some content exists to build brand awareness or community, and grading it purely on revenue misses the point. The goal is knowing which content is meant to sell and measuring that content accordingly, rather than applying one yardstick to everything.

    What is the difference between attribution and incrementality?

    Attribution assigns credit to specific touchpoints along a customer’s path to purchase. Incrementality measures whether a marketing action actually caused a sale that would not have happened otherwise, usually through a holdout group or a controlled test. A piece of content can carry heavy attribution credit and still add little incremental revenue if the customer was always going to buy anyway. Most DTC teams use attribution for everyday content decisions and save incrementality testing for validating bigger budget shifts.

    Do platform native shopping tools already handle this?

    Partly. Instagram, TikTok, and YouTube shopping tools track clicks and, in some cases, on-platform purchases reasonably well. Where they fall short is anything that happens off platform, a customer who clicks through to a separate storefront, browses, and buys three days later on a different device. That gap is exactly why most DTC brands end up layering a cross-platform audit on top of native shopping analytics rather than relying on either alone.

  • Why Your Best Video Is Leaking Revenue (And How to Find It in 10 Minutes)

    Why Your Best Video Is Leaking Revenue (And How to Find It in 10 Minutes)

    Somewhere in your channel is a video that is doing everything right. Good views, strong retention, comments full of people asking where to buy the thing you mentioned. And somewhere in that same video is a missing tag, a dead link, or a description that never got updated, quietly handing money to nobody.

    You would notice if a sponsor stopped paying you. You are far less likely to notice a broken affiliate link sitting in a video that is still getting views a year later. That is the entire problem with revenue leaks. They do not show up as a dramatic drop. They show up as nothing at all, just money that was always supposed to arrive and never does.

    50%+ of affiliate revenue creators are entitled to gets lost to misattribution and broken redirects Button creator commerce data, cited 2026
    43% more clicks on tagged products when a timestamp is added alongside the tag YouTube internal data, January 2025
    71% year over year growth in shoppable video placements across YouTube, TikTok, and Instagram 2026 creator commerce industry data

    The Video That’s Working and Still Losing You Money

    Picture a mid-size cooking channel, a few hundred thousand subscribers, posting steady weekly recipes. One video, a fifteen-minute butter chicken tutorial, pulls in 2.4 million views. By every normal measure, that is a hit. Except when someone actually checks the video, three products mentioned on camera were never tagged. No affiliate link, no description mention, nothing for a viewer to click even if they wanted to buy the pan or the spice blend on screen.

    That is not a hypothetical. It is close to the exact situation Bluekona surfaces constantly when creators run their first channel audit, high performing videos sitting right next to a revenue gap nobody had gone looking for. The video is not underperforming. The monetization behind it is.

    What a Revenue Leak Actually Looks Like

    Missing Product Tags

    You mention a product on camera, maybe even show it, but never add the tag, the pinned comment, or the description link that turns that mention into a click. This is the most common leak, and it is almost always accidental. You are focused on the edit, the thumbnail, the title. Tagging every product mentioned in a fifteen-minute video is easy to forget.

    Broken or Expired Affiliate Links

    Retailers restructure their affiliate programs. Amazon updates its associate link format. A product gets discontinued and its page redirects somewhere useless. None of this shows up in your analytics as a problem. It just quietly stops paying out, sometimes for months before anyone notices.

    Untimed Tags on Your Highest-Retention Moments

    Even when a tag exists, where it appears in the video matters. A tag sitting in the description with no timestamp asks viewers to go hunting for it. A tag with a timestamp, placed right at the moment the product appears on screen, catches people while their interest is highest. The data backs this up clearly, tagged products paired with a timestamp get 43% more clicks than a description link alone, according to YouTube’s own internal figures from January 2025.

    Delphi, Bluekona AI mascot

    Creators are excellent at making things people want to watch. Most are terrible at bookkeeping. Both things can be true, and only one of them is costing you money.

    Why This Happens Even to Careful Creators

    Nobody sets out to leave money on the table. It happens because the work of making a video and the work of maintaining its monetization live on completely different timelines. You publish once. The video keeps earning, or should keep earning, for years. But nobody goes back and checks whether the affiliate program you joined two years ago still uses the same link format, or whether that discontinued product page is now redirecting to a 404.

    Channels growing fast feel this the most. More videos, more products mentioned, more affiliate relationships to track, and no time built into the schedule for checking any of it. The bigger the back catalog gets, the bigger the blind spot gets with it.

    How Much This Is Actually Costing You

    The scale here is bigger than most creators assume. Misattribution and broken redirects alone cause creators to miss more than half of the affiliate revenue they are technically entitled to, based on Button’s creator commerce data cited in 2026 industry reporting. Meanwhile creator affiliate revenue as a category grew 47% year over year in 2026 and now makes up 24% of total affiliate spend, up from just 11% in 2022, according to Awin’s 2026 affiliate marketing statistics. The pie is growing quickly. A leak in your share of it costs more every year it goes unfixed, not less.

    The Real Cost Isn’t the Missing Tag

    It’s the compounding effect. A video that keeps earning views for years also keeps losing the same untagged revenue for years. Fixing one video today is worth more than fixing ten videos five years from now, simply because of how much longer the fix has to work in your favor.

    The 10-Minute Audit

    This does not require new software or a weekend. It requires ten focused minutes and a willingness to actually click your own links.

    Step 1, Pull Your Top 20 Videos by Views

    Sort your channel by views, not by upload date. Your highest performing videos are where a small fix produces the biggest return, since they have the most eyeballs still landing on whatever tag or link sits underneath them.

    Step 2, Check Tags Against What You Actually Say

    Watch the first thirty seconds and skim the middle of each video. Note every product, tool, or brand you mention out loud or show on screen. Then compare that list against what is actually tagged in the description or pinned comment. Gaps show up fast once you are looking for them on purpose.

    Step 3, Click Every Link

    Not skim, click. A link that looks fine in the description can still redirect to a dead page, an out of stock listing, or a generic homepage instead of the actual product. This step alone catches most of the silent leaks in an older back catalog.

    Step 4, Flag and Fix

    Keep a simple list as you go, video, timestamp, what’s missing or broken. Fix the highest-view videos first. A single afternoon spent working through this list against your top twenty videos usually closes the biggest gaps in your entire channel.

    Checking your own affiliate links is not glamorous content. It is, without question, the highest return on ten minutes you will get all week.

    Delphi, Bluekona AI mascot

    Building a Habit So It Doesn’t Happen Again

    A one-time audit fixes today’s leak. It does not stop tomorrow’s. The creators who actually keep this under control build a small habit around it instead of treating it as a one-off cleanup project.

    Leak typeWhat it looks likeHow often to checkRisk if ignored
    Missing product tagsProduct shown or mentioned, no tag addedEvery new uploadHigh
    Broken affiliate linksLink redirects to a dead pageMonthly, top 20 videosHigh
    Untimed tagsTag exists only in descriptionQuarterly reviewMedium
    Outdated program linksOld link format no longer trackedWhen program terms changeMedium
    Discontinued products taggedTag points to a product that no longer existsTwice a yearLow
    Leaking revenue

    Tags added once at upload and never revisited. Links trusted forever. Older top-performing videos treated as finished, not as ongoing income.

    Healthy tagging habit

    Top videos re-checked on a schedule. Links clicked, not just glanced at. Every new upload tagged completely before it goes live, not fixed later.

    Running a habit like this manually across dozens or hundreds of videos is exactly where it falls apart for growing channels. This is the gap a proper YouTube channel audit is built to close, one pass across your whole library instead of a mental note you keep meaning to act on.

    Your Back Catalog Is Still a Revenue Channel

    It is easy to think of monetization as something that happens at publish time and then stops mattering. The numbers say otherwise. 63% of global viewers say they have bought something they first discovered on YouTube, according to YouTube’s own Culture and Trends team, and shoppable video placements across YouTube, TikTok, and Instagram grew 71% year over year. Viewers are already primed to buy from video. The only question is whether your older content still gives them a working way to do it.

    Every video sitting in your back catalog with views still trickling in is a small, ongoing revenue channel, whether you are actively thinking about it or not. Treating your top twenty videos as something to audit and maintain, not something you finished the day you hit publish, is the difference between a channel that grows its return on existing content and one that keeps making new videos to replace the earnings the old ones quietly stopped delivering.

    Delphi, Bluekona AI mascot

    Your old videos didn’t stop earning because people stopped watching. They stopped earning because nobody went back to check on them. Big difference.

    Find Out Which of Your Top Videos Are Actually Leaking

    Run the free YouTube Channel Audit and see which of your videos are missing tags, carrying broken links, or sitting on untapped revenue right now.

  • AI Content Disclosure, Does Labeling AI-Assisted Posts Build Trust or Kill Reach?

    AI Content Disclosure, Does Labeling AI-Assisted Posts Build Trust or Kill Reach?

    Somewhere in your feed right now sits a caption that reads a little too polished and a little too fast to have been typed by hand. You scroll past without deciding whether a human or a tool wrote it, mostly because you cannot tell, and the brand that posted it never said either way.

    That uncertainty is the normal state of social media in 2026. AI tools have moved past the experimental phase inside marketing teams and into daily habit. 87% of marketers now use AI for social media, and 89.7% of social media professionals reach for an AI tool several times a week, according to Sociality.io’s 2026 AI in Social Media Marketing report. The tools are no longer a novelty. They are the default first draft.

    What has not settled is what brands owe their audience once that draft goes live. Do you say a caption started as a prompt. Do you mention a product image was generated instead of shot. The platforms are now answering that question whether marketing teams like it or not, and the consumer data on what happens next is messier than most teams expect.

    91% of consumers expect brands to disclose AI use in marketing, yet only 20% of brands always do Fractl, 2026 AI Search Consumer Trust Study
    31% say visible AI-generated content makes them trust a brand less, versus 7% who trust it more Fractl, 2026
    50% of Gen Z have unfollowed, muted, or blocked an account they believed was posting AI content Sprout Social, Q1 2026 Pulse survey

    Why This Question Won’t Go Away in 2026

    Every content calendar built this year runs into the same quiet decision point. A tool helped write this caption, clean up this photo, or generate this video clip. Saying so used to feel optional, almost like admitting you used a spellchecker. It no longer works that way.

    Platforms have started making the choice for brands, and audiences have opinions that do not sit still long enough to build a simple rule around. A founder posting three times a week does not have the bandwidth to run a research study before every post. What they need is a clear read on what the data actually says, and a workable policy they can apply without overthinking each caption. That is what the rest of this piece is built to give you.

    The tension worth naming early is this. Consumers say, loudly and consistently, that they want transparency. Then, in the same surveys and in controlled studies, they respond to visible AI labels by trusting the content less and engaging with it less. Holding both of those facts at once is uncomfortable, but it is also the actual situation SMB marketers are operating inside right now.

    Delphi, Bluekona AI mascot

    People say they want the truth about your content, then they get grumpy the second they actually see it. Welcome to marketing in 2026.

    What the Platforms Now Require

    Brands debating whether disclosure is worth the trust hit are increasingly finding the decision made for them. Each major platform has landed on a different enforcement model, and the differences matter for how much control a small team actually has.

    TikTok’s Automated Detection

    TikTok now requires visible labels on AI-generated visuals and audio that depict realistic people or scenes. The platform reads C2PA Content Credentials to catch synthetic media automatically, even when a creator skips the disclosure step entirely. After three unlabeled AI videos, TikTok cuts account reach by roughly 60% for 30 days and pauses Creator Fund earnings during that window.

    Meta’s In-Post Tag

    Meta unified its AI content rules across Instagram and Facebook in February 2026. Disclosure now has to appear as a tag above the post itself, separate from the caption, similar in placement to a paid partnership label. Burying an AI disclosure in the ninth line of a caption no longer satisfies the requirement.

    YouTube’s Manual Flagging

    YouTube still relies on creators to flag AI-generated content themselves, with penalties building for repeated failure to disclose. It is the least automated of the three systems, which puts more responsibility, and more room for judgment calls, on the creator.

    PlatformDisclosure methodDetectionPenalty for skipping it
    TikTokVisible label on synthetic visuals or audioAutomatedReach cut ~60% for 30 days after 3 violations
    MetaIn-post tag above the contentManualContent restrictions, tag added if missed
    YouTubeCreator-flagged disclosureManualEscalating penalties for repeat non-disclosure

    The Trust Data Is a Contradiction

    What Consumers Say They Want

    Ask people directly and the answer is close to unanimous. 91% of consumers expect brands to disclose when AI played a role in their marketing, according to Fractl’s 2026 AI Search Consumer Trust Study. Yet only 20% of organizations always disclose, and 33% never do. That gap between what audiences expect and what brands actually deliver is the real starting point for any disclosure policy.

    What Happens When They See the Label

    Here is where it gets uncomfortable. The same Fractl research found that only 7% of consumers say visible AI-generated content makes them trust a brand more, while 31% say it makes them trust the brand less. Wanting transparency in principle and rewarding it in practice turn out to be two different behaviors.

    The Real Question Isn’t Whether to Disclose

    Platforms have already removed “quietly hide it” as a viable long-term option. The actual decision left for SMBs is what to disclose, how specifically, and how that disclosure is worded, since those choices are what separate a trust-building label from a trust-damaging one.

    TikTok reading your content’s digital fingerprints means hiding AI use isn’t a strategy anymore. It’s just a risk you’re choosing to take.

    Delphi, Bluekona AI mascot

    Why Labels Sometimes Kill Reach (and Sometimes Don’t)

    Recent academic work on AI content labeling adds useful nuance to the blunt trust numbers above. Studies published through 2026 found that labeling content as AI-generated or AI-assisted reduced both emotional and behavioral engagement compared to unlabeled human-created content, especially for posts built around an emotional hook. Once someone knows a post came from a tool, they respond to it differently, often less warmly.

    But at least one study found a more encouraging pattern sitting underneath that headline result. Disclosure had a positive moderating effect on the relationship between content inauthenticity and engagement, meaning that when the underlying creative was strong, labeling it as AI-assisted protected engagement rather than tanking it. The label itself is not automatically the problem. A weak, obviously synthetic post that also gets labeled tends to underperform twice over. A strong, well-made post that gets labeled tends to hold up.

    This is the piece most SMBs miss when they read a scary headline about AI labels killing reach. The label is not erasing good content. It is removing the cover that let mediocre content coast on ambiguity. If you have been relying on your audience not noticing the difference, that grace period is closing. If you are using AI tools well, inside a real content lifecycle rather than as a shortcut around effort, disclosure is far less risky than it looks on paper.

    The Gen Z Problem

    The demographic split in this data deserves its own section because it changes the calculus depending on who your audience actually is. Half of Gen Z say they have unfollowed, muted, or blocked an account because they believed its content was AI-generated. That is not a mild preference. That is an active rejection behavior, and it is concentrated in exactly the age group most SMBs are trying hardest to reach on Instagram, TikTok, and Threads.

    Older audiences, by contrast, tend to respond more to whether the content is useful and well made than to whether a tool touched it along the way. A brand serving a 45-plus audience on Facebook is working with a very different risk profile than a brand chasing 19-year-olds on TikTok. Your disclosure policy should account for that split rather than applying one blanket rule across every platform you post on.

    A Disclosure Framework for SMBs (What to Label, What Not To)

    The distinction that actually matters is not “did AI touch this content” in some abstract sense. Nearly every post touches AI somewhere now, whether that is a grammar check, a scheduling tool, or a caption idea. The distinction that matters is between AI-assisted work, where a human wrote the real substance and used a tool to speed up production, and AI-generated work, where the tool produced the core content itself, especially realistic images, video, or audio of people.

    Skip the disclosure

    Using AI to brainstorm caption ideas you then rewrote yourself. Using AI to resize or color-correct a photo you actually shot. Using AI for grammar and spell checking.

    Disclose clearly

    A fully AI-generated image or video, especially one depicting a realistic person. AI-written copy that ran with no meaningful human edit. A synthetic voiceover standing in for a real person.

    That split lines up with what most consumers actually seem to object to. The trust data is not punishing brands for using a grammar checker. It is punishing brands for letting a fully synthetic image or video pass as authentic without saying so. Framing your policy around this distinction, rather than trying to disclose every single tool touchpoint, keeps you honest without turning every caption into a legal disclaimer.

    How to Disclose Without Undercutting Your Own Content

    Wording matters more than most brands assume. A flat, generic label like “AI-generated content” reads as a compliance stamp and does little to build trust on its own. A specific, human sentence does more work. Something like “we used AI to help draft this caption, then edited it ourselves” tells your audience exactly what happened and signals that a person was still involved and cared about the result.

    1. Be specific about what the tool did.

      “AI-assisted” tells your audience nothing on its own. “AI helped generate the visuals, our team wrote the copy” tells them everything they need.

    2. Put the disclosure where the platform expects it.

      Follow Meta’s in-post tag placement or TikTok’s on-screen label rather than burying a mention deep in the caption, since audiences and moderation systems both read prominent placement as more honest.

    3. Pair disclosure with your strongest creative, not your weakest.

      Since the research shows labels protect engagement when the underlying content is strong, do not save disclosure practice for your lowest-effort posts.

    4. Test the wording itself. 

      Treat disclosure language like any other content variable. Run one version against another the same way you would test a hook, following the same one-variable-at-a-time approach covered in our piece on organic content experiments without a budget.

    Delphi, Bluekona AI mascot

    Disclosure isn’t a confession booth. It’s a chance to remind people a real person is still steering the ship, and that’s worth saying out loud.

    Turning Transparency Into a Trust Advantage

    Most of the brands your audience follows are still treating disclosure as a liability to minimize rather than a habit to build. That gap is an opening. A brand that discloses clearly, pairs that disclosure with genuinely strong creative, and keeps a real human voice active in the process is doing something the majority of accounts in any given feed are still avoiding.

    This only works as a long-term habit if you are also watching how your audience actually responds, not just guessing. That is where a real human brand approach and consistent auditing work together. You cannot fix a disclosure policy you are not measuring, and most small teams have no clean way to see whether a labeled post is landing differently than an unlabeled one across YouTube, Instagram, Facebook, and Threads at once.

    Brands that treat AI as one tool inside a broader strategy, rather than the whole strategy, tend to scale with AI without losing the trust that got them followers in the first place. Disclosure is not the enemy of growth. Sloppy, unexamined use of AI is. Get the distinction right, and transparency becomes one more reason your audience sticks around instead of one more reason they scroll past.

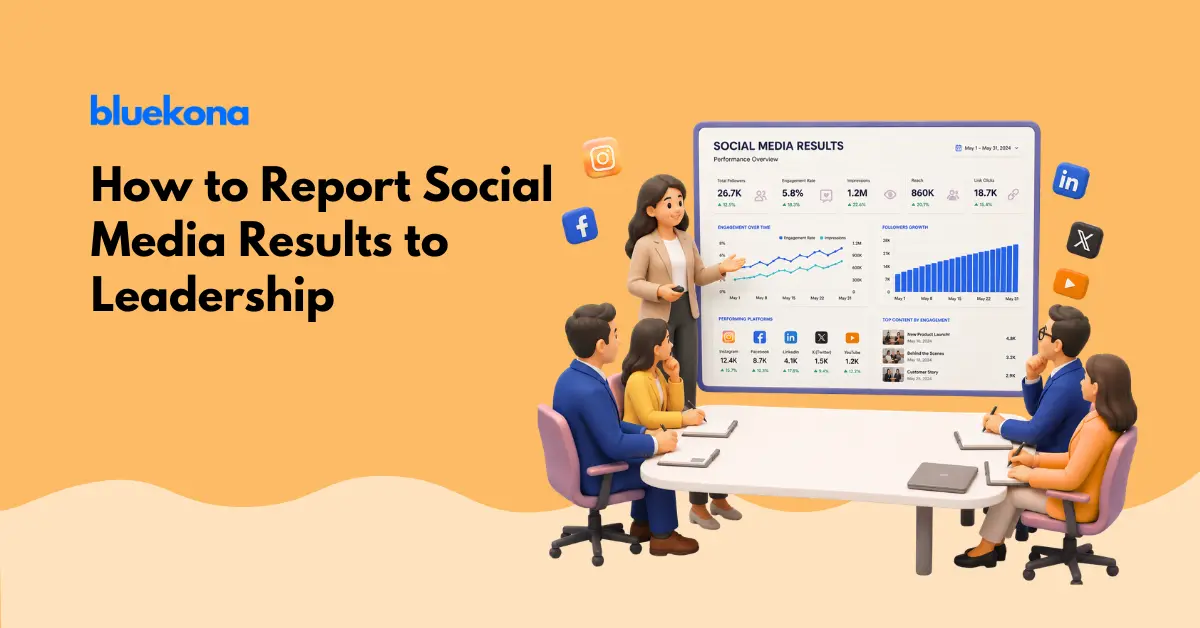
  • How to Report Social Media Results to Leadership Without Losing the Room

    How to Report Social Media Results to Leadership Without Losing the Room

    You spend an hour every month pulling numbers into a slide deck. Reach is up. Engagement is up. Followers are up. Then you present it to your founder or your leadership team, and the room goes quiet in the wrong way. Nobody argues with the numbers. Nobody looks convinced by them either.

    That gap is one of the most common frustrations in marketing right now. 65% of leadership want to see direct connections between social campaigns and business goals, and 52% want quantifiable cost savings across their channels. Your report might be perfectly accurate. It might just be answering questions nobody in that room is actually asking.

    This guide walks through how to build a social media report leadership actually trusts, one that speaks in business outcomes instead of platform metrics, and how tools like Bluekona’s AI powered audits can do most of that translation work for you automatically.

    65%
    of leadership want social campaigns tied directly to business goals
    Verloop, August 2025
    30%
    of marketers believe they can actually measure social media ROI
    Statista, May 2025
    21%
    rise in board pressure on marketing leaders to prove ROI since 2023
    The CMO Survey, Spring 2025

    Why Your Leadership Report Keeps Falling Flat

    Most social media reports fail for a simple reason. They are written by a marketer, for a marketer. Every number on the page makes sense to the person who built the dashboard. Almost none of it maps cleanly onto the questions a founder or a CFO is actually holding in their head walking into that meeting.

    The metrics you track aren’t the metrics they care about

    Reach, impressions, and engagement rate are genuinely useful. They tell you whether your content strategy is working from one week to the next. They tell your leadership almost nothing about whether the marketing budget is paying for itself. When a report opens with platform level metrics, it is speaking a language leadership never agreed to learn. Our piece on the problem with social media metrics goes deeper into why this disconnect exists in the first place, and it is worth reading before you build your next report.

    The attribution gap everyone feels but nobody names

    Nearly every executive believes social media influences revenue somewhere along the funnel. Very few of them can point to the exact number. 97% of leaders believe they can communicate social media’s value internally, yet only 30% of marketers believe they can actually measure social ROI, according to a Statista survey. That gap between belief and proof is the whole problem. Believing something matters is not the same as proving it, and leadership knows the difference even when they cannot articulate it.

    Delphi, Bluekona AI mascot

    Everybody believes social media works. That’s cute. Show me the number or it did not happen.

    What Leadership Actually Wants to Hear

    Leadership is not asking you to abandon social media metrics. They are asking you to translate them. A founder does not need to know your share to reach ratio. They need to know whether the marketing team is moving the business forward, and by roughly how much.

    Business outcomes over vanity metrics

    Followers, likes, and impressions are participation numbers. They describe activity, not impact. Business outcomes such as qualified leads generated, website traffic from social, revenue assisted by social touchpoints, and customers retained through social support are the numbers that connect your work to what leadership actually manages toward. Pressure to make that connection keeps climbing. The CMO Survey found that board level pressure on marketing leaders to prove ROI rose 21% between 2023 and 2025, with pressure from the CFO alone climbing 52% in the same period.

    The three questions every executive is silently asking

    Every leadership report should answer three questions, whether or not leadership says them out loud. Is this working, translated into numbers a P&L would recognize. Is this worth what we are spending on it, compared to other channels. What happens to the business if this budget got cut in half next quarter. If your report cannot answer those three questions on the first page, everything else you present is just supporting detail nobody asked for.

    The Report Structure That Actually Lands

    The single biggest change you can make to a leadership report has nothing to do with which metrics you include. It is the order you present them in.

    Lead with the business question, not the platform breakdown

    Open with the outcome, then support it with the platform data, not the reverse. Start the report with a single sentence such as “social media contributed to 40 qualified leads and an estimated portion of pipeline this quarter,” then use the rest of the page to show your work. Most reports do this backwards, opening with an Instagram summary, then a Facebook summary, then a LinkedIn summary, and only mentioning business impact on the last slide if there is time left. Leadership checks out long before that slide arrives.

    One page, three numbers, one story

    Discipline is the differentiator here. Pick three numbers that matter most this period, not fifteen. Wrap them in a single narrative about what changed and why. A report with three well chosen numbers and a clear story beats a report with thirty numbers and no throughline, every single time.

    The One Page Rule

    If your leadership report cannot fit on one page with room to breathe, you have not finished editing it yet. Cut until the story is obvious, then stop.

    One page. Three numbers. One story. If your report needs its own table of contents, you already lost the room.

    Delphi, Bluekona AI mascot

    Where Bluekona does the translation work for you

    Pulling this structure together manually every month means logging into four different platform dashboards, exporting spreadsheets, and reconciling numbers that were never designed to sit next to each other. This is exactly the gap Bluekona was built to close. A cross-platform social media audit from Bluekona pulls your YouTube, Instagram, Facebook, and Threads data into one place and applies AI generated insights that already speak in outcomes rather than raw platform metrics. Instead of spending an afternoon reconciling numbers, you get a business ready summary you can drop straight into your leadership report, along with the supporting detail if anyone asks for it. You can also see how our guide on scaling social media strategy with AI connects to this same idea of letting automation carry the reporting workload.

    Turning Raw Metrics Into an Executive Narrative

    Once you have your three numbers, the next skill is translation. This is where most reports either win the room or lose it entirely.

    From engagement rate to pipeline signal

    Engagement rate on its own means little to leadership. Reframed as a pipeline signal, it becomes useful. Instead of reporting “engagement rate was 4.2% this month,” report “content that answered a specific customer question generated three times the saves and drove a measurable increase in demo requests.” The number is the same underlying data. The story is what makes it land. Our post on the link between content and conversion breaks down how to make that connection credibly instead of stretching the data further than it can go.

    From reach to brand equity, in plain language

    Reach and impressions are not worthless, they are just misunderstood at the leadership level. Reframe them as brand equity building, the slow accumulation of familiarity and trust that eventually shortens your sales cycle. Say it plainly. “Our reach growth this quarter means more of our target buyers recognize the brand before a sales conversation ever starts.” That sentence does more work in a leadership meeting than any reach chart ever will.

    A Sample Monthly Leadership Report Template

    Here is a simple structure you can adapt starting with your next reporting cycle. It leads with outcomes, keeps supporting metrics visible, and flags status clearly so leadership can scan it in under a minute.

    MetricWhat It Tells LeadershipStatus
    Social assisted revenueDirect dollar contribution from social touchpointsOn Track
    Qualified leads from socialVolume feeding directly into the sales pipelineWatch
    Cost per social acquired customerEfficiency compared to paid alternativesOn Track
    Branded search volumeLong term brand equity buildingAt Risk

    What to include, what to cut

    Include anything that ties back to revenue, pipeline, retention, or brand equity. Cut anything that only measures activity, such as number of posts published or hours spent on content creation. Those numbers matter to you as a manager. They mean nothing to someone deciding whether to fund next quarter’s budget.

    Common Mistakes That Undermine Your Credibility

    A few habits quietly damage trust in your reporting over time, even when the underlying work is strong.

    Strong Report
    • Opens with one clear business outcome
    • Three metrics maximum on the summary page
    • Plain language, no platform jargon
    • Flags risk areas honestly, before leadership asks
    Weak Report
    • Opens with a platform by platform breakdown
    • Fifteen or more metrics with no clear priority
    • Heavy jargon assumed to be self explanatory
    • Only positive numbers shown, risk buried or skipped

    Overloading the room with data

    More data does not build more trust. It usually does the opposite. When leadership sees twenty charts, they assume you are hiding the real story behind volume. A tight report signals confidence. A dense one signals uncertainty, even when the underlying numbers are good.

    Reporting activity instead of outcomes

    Number of posts, number of stories, number of hours spent editing video, these describe effort, not results. Leadership funds results. If your report leans heavily on activity metrics, it reads as an excuse for a missing outcome rather than evidence of one.

    Building a Reporting Cadence Leadership Trusts Over Time

    One good report earns attention. A consistent cadence earns trust. Report on the same three to five outcome metrics every single cycle so leadership can see trendlines, not just snapshots. Flag risk honestly and early, since leadership forgives a missed number far more easily than a surprised one. And keep the format identical every time. Predictability is part of what makes a report feel credible, because leadership starts to recognize the pattern and trust what sits inside it.

    None of this requires a new dashboard built from scratch or a data analyst on staff. It requires a consistent source of truth across every platform you run, translated into language that matches how your leadership actually thinks about the business.

    Delphi, Bluekona AI mascot

    Let Bluekona chew through the platform data so you walk into that meeting looking like the smartest person in it. I will take the credit later.

    If you are rebuilding your reporting process this quarter, start with a single cross platform audit. Seeing your YouTube, Instagram, Facebook, and Threads performance translated into one business ready summary is usually the fastest way to spot which three numbers deserve the spotlight in your very next leadership meeting. Our guide to tracking content performance without a spreadsheet pairs well with this process if you want to go deeper on the mechanics.

  • How Agencies Can Use AI Audits to Win and Retain More Clients

    How Agencies Can Use AI Audits to Win and Retain More Clients

    Client churn is the quiet tax every agency pays. In 2026, that tax has gotten steeper. Social media agencies are losing clients faster than almost any other service specialization, and the reasons are shifting under everyone’s feet. Brands are pulling creative work in house. AI tools promise to make execution cheap and replaceable. And clients are leaving over dissatisfaction that agencies rarely see coming until the cancellation email arrives.

    The agencies pulling ahead this year are not the ones running from AI. They are the ones using it in the one place it actually protects the relationship, the audit. A well-run cross-platform audit does something a status report never can. It proves strategic value, catches problems before they turn into cancellations, and gives an account manager a real reason to walk back into a client’s inbox with something worth reading.

    This piece breaks down why agencies are churning faster in 2026, why not every AI use case pays off the same way, and how to build audits into a retention engine your clients actually notice.


    Why Agencies Are Losing Clients Faster Than Ever in 2026

    Social media agencies now face 46% annual client churn, second only to paid media agencies at 49%, according to Focus Digital’s 2026 Agency Churn Report. That number sits inside a bigger shift. Two forces are driving it, and most agencies are only prepared for one of them.

    46%
    Annual churn for social media agencies, second highest of any specialization
    Focus Digital, 2026 Agency Churn Report
    48%
    Of departing clients cite dissatisfaction with delivery, up 14 points year over year
    Focus Digital, 2026 Agency Churn Report
    34%
    Lower annual churn for agencies using AI-powered churn prediction in year one
    Focus Digital, 2026 Agency Churn Report

    The In-House Threat

    Nearly a third of brands, 32%, expect to bring all their creative work in house within the next 12 months, according to the same Focus Digital report. That threat lands hardest on agencies that position themselves as execution shops. If your value proposition amounts to “we post content and send a recap,” a marketing hire with an AI subscription can replicate most of that within a few months. Agencies that survive this shift are the ones clients see as strategists, not vendors.

    The Delivery Gap Nobody Sees Coming

    The more surprising number is this one. 48% of clients who left an agency in 2026 cited dissatisfaction with delivery as the reason, up 14 percentage points from the year before. Agencies, meanwhile, ranked delivery dissatisfaction seventh on their own internal list of churn risks. That gap between what clients feel and what agencies notice is where most preventable churn happens.

    The clients most likely to leave are not complaining loudly. They are quietly comparing your monthly recap to what an AI tool could generate for a fraction of the cost.

    Not All AI Use Is Equal

    Agencies rushed into agentic AI over the last 18 months, and the payoff has been wildly uneven. A 2026 survey of 250 marketing and development agencies by Digital Applied found that audit-style workflows return an 11.4x median ROI, the highest of any agentic use case measured. Client report drafting, the most common agency AI use case, returned just 1.6x, the lowest of the seven workflows studied.

    The gap makes sense once you think about what each workflow actually replaces. Report drafting automates work that was already low value to the client. Audits replace hours of senior strategist time spent analyzing what is genuinely working, and clients pay full rate for that kind of insight. One workflow makes an agency look more replaceable. The other makes it look indispensable.

    Audit-led AI use

    Diagnosis clients pay for

    Surfaces insights across platforms that clients cannot get on their own, gives account managers something new to say every month.

    11.4x median ROI
    Report-only AI use

    A recap clients already skim

    Automates a summary the client barely reads and changes nothing about the strategy underneath it.

    1.6x median ROI
    Delphi, Bluekona AI mascot

    Nobody canceled a retainer because the report was not pretty. They canceled because the report told them nothing they didn’t already know.

    How Cross-Platform Audits Become a Retention Engine

    A cross-platform audit, one that pulls signal from YouTube, Instagram, Facebook, and Threads into a single set of AI-generated recommendations, does three jobs a status report never will. It wins the pitch. It catches churn before it starts. And it proves an agency is directing strategy, not just executing tasks.

    Winning the Pitch

    Prospects rarely choose an agency based on a proposal deck alone. A live audit of their current social presence, run before the first call, gives a team something no competitor pitch has, specific proof that the agency already understands the business. Manual audits take days and rarely survive past the first draft. An AI-generated audit takes minutes and gives the team the rest of the week to build a strategy around it instead of a spreadsheet.

    The 30, 60, 90 Day Check In

    Focus Digital’s churn data shows retainer clients lose about 8% of accounts in the first six months, with project-based clients losing nearly 28% in that same window. The first 90 days decide more relationships than any other stretch of the engagement. Running an audit at day 30, 60, and 90, rather than waiting for the quarterly business review, gives an account manager a natural reason to show measurable movement early, before doubt has time to set in.

    Proving Strategy, Not Just Execution

    The agencies most exposed to in-housing are the ones whose only visible output is content and a recap. Audits shift the conversation. Instead of “here is what we posted,” the conversation becomes “here is what the data says to do next, and here is why.” That distinction is exactly what separates a strategic partner from a vendor a client can eventually replace with a junior hire and a chatbot. Scaling strategy with AI only works if the AI output looks like strategy, not just automation.

    Waiting for the quarterly review to prove your value is like waiting for the tide to come in after the boat’s already left the dock.

    Delphi, Bluekona AI mascot

    Building an Audit-Led Service Layer With Bluekona

    Bluekona was built for exactly this workflow. It runs cross-platform audits across YouTube, Instagram, Facebook, and Threads, then turns the raw data into AI-generated insights an account manager can hand a client without translation. Instead of pulling metrics by hand or hiring a dedicated analyst, agencies use Bluekona to package proof of value into every pitch, every 30/60/90 day check in, and every renewal conversation.

    The AI-powered content repurposing layer matters here too. An audit that only diagnoses a problem leaves a client wondering what happens next. Bluekona pairs its findings with specific repurposing recommendations, so the “here’s what’s wrong” conversation always comes with a “here’s what we do about it” answer attached. That combination, diagnosis plus a concrete next step, is what turns an audit from a nice report into proof a retainer is worth renewing.

    For agencies juggling a dozen or more client accounts, the workspace model matters as much as the audit itself. Bluekona lets a team run every client’s cross-platform audit from a single dashboard, rather than logging into four different native analytics tools per client and stitching the numbers together in a spreadsheet. That structure is what makes the 30/60/90 day cadence realistic at scale. An account manager covering ten clients cannot manually rebuild a full audit for each one every month, but pulling an updated AI-generated audit from an existing workspace takes minutes, not a full afternoon per client.

    There is a hiring angle here too. As junior analyst and reporting roles compress across the industry in favor of AI-assisted workflows, agencies still need someone directing the strategy those audits point toward. Handing a strategist a clean, AI-generated audit instead of a pile of raw exports frees that person to spend their time on the part of the job a client is actually paying for, judgment.

    A Simple Framework for Rolling This Out This Quarter

    An agency does not need to rebuild its entire service model to start using audits as a retention tool. Four steps get most teams from pilot to habit inside a single quarter.

    TimelineActionFocus
    Weeks 1 to 2Run baseline audits across every active client’s core platformsFoundation
    Weeks 3 to 4Lead every new prospect call with a live audit instead of a template deckQuick win
    Month 2Build a standing 30, 60, and 90 day audit cadence into onboardingRetention
    Month 3Use quarter-over-quarter audit data as the backbone of renewalsScale

    Agencies are not losing clients because AI got better. They are losing clients because the gap between what agencies deliver and what clients now expect got wider, and audits are the fastest way to close it. The agencies still standing in 2027 will be the ones who used AI to prove strategic value quarter after quarter, not the ones who used it to draft a slightly faster status update.

    See what an AI-powered audit shows your next client

  • How Often Should SMBs Actually Post? What 2026 Data Says

    How Often Should SMBs Actually Post? What 2026 Data Says

    Every SMB marketing team has stared at a blank content calendar and asked the same question. How many times a week do we actually need to post? Ask ten agencies and you get ten different numbers. Ask an algorithm update and the number changes again next quarter. The good news is that fresh 2026 data gives a much clearer answer than most advice columns offer, and it has almost nothing to do with hitting a magic number.

    This article breaks down what the newest research says about posting frequency on Instagram, Facebook, and YouTube. It also explains why the “right” number is different for every account, and how to stop guessing and start using your own engagement data instead.

    Why “Post Every Day” Became the Default Advice

    The daily posting rule got popular for an honest reason. Early social algorithms rewarded raw activity, and agencies with big teams that posted constantly grew fast. Smaller teams copied that playbook without asking whether it fit their resources or their audience.

    Most SMB teams don’t have an agency’s headcount. A founder running marketing solo, or a two-person team splitting content across four platforms, doesn’t have the bandwidth to post daily on Instagram, Facebook, and YouTube at once. Following advice built for a fifteen-person social team usually leads to burnout, rushed content, and a feed full of filler posts nobody engages with.

    Delphi, Bluekona AI mascot

    Posting five times a day just to look busy is like a fish swimming in circles. Looks like effort, goes nowhere.

    What the 2026 Data Actually Shows

    Buffer’s 2026 State of Social Media Engagement report analyzed more than 52 million posts across ten platforms, collected between 2024 and 2025. It is one of the largest posting frequency studies available, and its findings are more useful than any single “post X times a week” rule.

    450%
    More engagement per post for accounts posting in 20 or more of 26 weeks
    Buffer, State of Social Media Engagement 2026
    66%
    More subscribers for YouTube channels posting 12 or more times a month
    VidIQ, 2026 channel analysis
    42%
    More engagement on Threads for accounts that reply to comments
    Buffer, State of Social Media Engagement 2026

    Consistency Beats Volume

    The single biggest factor in the Buffer study was not posting frequency. It was consistency over time. Accounts that posted in at least 20 of the 26 weeks measured saw roughly 450 percent more engagement per post than accounts that posted in four weeks or fewer. Accounts that posted somewhere in between, five to nineteen weeks, still saw about 340 percent more engagement than sporadic posters.

    That gap is bigger than the difference between any two specific posting frequencies. A brand that posts three times a week, every single week, will likely outperform a brand that posts daily for two weeks and then disappears for a month. This is exactly the pattern Bluekona’s own research on content velocity versus content quality points to as well.

    Showing up three times a week, every week, beats showing up daily until you get tired and vanish for a month. Consistency is the actual flex.

    Delphi, Bluekona AI mascot

    Platform by Platform Benchmarks

    Once consistency is locked in, platform benchmarks are a useful starting point for how much to post. Here is what recent research points to for the platforms Bluekona covers.

    PlatformRecommended FrequencyWhat the Data ShowsImpact
    Instagram3 to 5 feed posts weekly, plus 2 to 4 ReelsIn-feed posts perform best around 3 to 5 times weekly, while Reels need higher frequency to sustain reachHigh Impact
    Facebook1 to 2 posts per dayA HubSpot study of over 13,500 Facebook users found this frequency performs bestModerate
    YouTube Shorts3 to 5 Shorts weeklyChannels posting 12 or more times monthly gain 66 percent more subscribersHigh Impact

    Where the Returns Start Shrinking

    Buffer’s data also shows a real ceiling. Moving from one post a week to two to five posts a week produces a strong lift in views per post. Posting six to ten times a week adds more gains, but each additional post adds less than the one before it. Beyond that point, reach per individual post tends to decline even as total account activity climbs.

    In plain terms, more posts grow an account’s total reach, but each post reaches a shrinking slice of the audience. That tradeoff works fine for teams with the capacity to sustain it. It becomes a losing trade the moment it means every post gets less thought than the last one, a pattern covered in more depth in the problem with social media metrics.

    Quick Takeaway

    More posts grow total reach. Fewer, stronger posts grow reach per post. Pick the tradeoff that fits your team’s actual capacity, not the one that sounds most impressive in a meeting.

    Why the Right Number Is Different for Every Account

    Platform benchmarks are averages pulled from millions of accounts across every industry imaginable. Your account is not average. A dental practice’s audience checks Instagram differently than a beverage brand’s audience does. A B2B founder’s LinkedIn habits look nothing like a consumer brand’s Facebook habits.

    The benchmarks in this article are a reasonable starting point if you have no other information. But the moment you have a few weeks of your own posting history, your own numbers should carry more weight than any industry study, including this one.

    Works Well

    Posting Based on Your Own Data

    You track which formats and days actually drive engagement, then adjust your plan to match your audience.

    Falls Short

    Posting Based on a Generic Rule

    You copy a frequency number from a blog post or competitor and apply it regardless of your own audience behavior.

    How to Find Your Own Optimal Cadence

    Figuring this out manually means exporting data from several analytics dashboards, lining it up in a spreadsheet, and hoping a pattern appears before the quarter ends. Most SMB teams don’t have the hours for that, so they default to a generic number and hope for the best. This is the exact gap explored in tracking content performance across platforms without a spreadsheet or analyst.

    A cross-platform audit handles that comparison automatically. Instead of guessing whether Tuesday or Thursday works better for Instagram Reels, or whether a Facebook page is quietly overposting, you get a direct read on which days, formats, and frequencies are driving real engagement and leads on your specific accounts. Understanding how dwell time quietly controls reach also helps explain why some high-frequency accounts still underperform lower-frequency ones.

    A Realistic Weekly Posting Plan for Lean Teams

    For a founder or small team managing Instagram, Facebook, and YouTube without a dedicated analyst, a sustainable starting cadence looks like this. Three feed posts and two to three Reels on Instagram each week. Five posts a week on Facebook, spaced out rather than batched into a single day. Two to three YouTube Shorts a week, treated as a discovery tool for new viewers rather than an update reserved for existing subscribers.

    None of those numbers are fixed rules. They are a starting point to test for four to six weeks, then adjust once real engagement data shows what is actually working, an approach covered in detail in balancing content velocity and quality in the AI era.

    Batching production and batching publishing are two different things, and mixing them up is where a lot of lean teams burn out. Sitting down once a week to film and write several pieces of content is efficient. Publishing all of them on the same day is not, since it spreads a week’s worth of effort across a single 24-hour window instead of letting each post earn its own attention. Spacing scheduled posts across the week, even when they were all created in one sitting, tends to protect reach without adding any extra production time.

    Frequently Asked Questions

    Is it possible to post too often?

    Yes. Data shows reach per post can decline past a certain frequency, and audiences tend to tune out repetitive or overly promotional content. More posts should never come at the cost of quality.

    What happens if a team misses a week?

    One missed week will not undo months of consistent posting, but repeated gaps hurt more than most teams expect. The 2026 data shows accounts posting in fewer than a third of the weeks studied saw dramatically lower engagement than consistent posters.

    Should every platform get the same posting frequency?

    No. Facebook, Instagram, and YouTube reward different cadences and formats, which is exactly why platform-specific and account-specific data matters more than a single blanket number pulled from a general study.

    How long does it take to see whether a new cadence is working?

    Most accounts need four to six weeks of consistent posting before a new cadence produces a reliable read. Shorter test windows tend to get thrown off by a single viral post or a slow news week, so patience matters as much as the plan itself.

  • How to Benchmark Your Social Media Performance Against Competitors

    How to Benchmark Your Social Media Performance Against Competitors

    There is a quiet assumption most SMBs make about social media. They assume that if their numbers are going up, their strategy is working. But going up compared to what? If your competitors are growing twice as fast and you have no idea, you are not winning. You are just not watching the scoreboard.

    Competitive benchmarking is how you fix that. It is the process of measuring your social media performance against similar brands so you can set realistic goals, spot gaps in your content strategy, and stop making decisions based on gut feel. The good news is that you do not need a data team, a six-figure analytics subscription, or a full-time analyst to do it well. You need a clear framework and the discipline to use it consistently.

    Why Most SMBs Skip This Step

    The most common reason small businesses skip competitive benchmarking is time. Running a business is already a full-time job, and carving out extra hours to analyze what competitors are doing on social media feels like a luxury reserved for marketing teams with actual headcount.

    The second reason is information overload. Social media platforms produce enormous amounts of data, and without a clear framework, most of it feels useless. Marketers know they should be tracking something, but they are not sure what. The result is that most small business social accounts get optimized in isolation. They get better at what they are already doing but miss the larger strategic picture. That gap is an opportunity for any brand willing to look.

    What Competitive Benchmarking Actually Measures

    Benchmarking is not about counting your competitor’s followers and feeling either relieved or jealous. It is about identifying patterns in how they are growing, which content formats are working for them, and where gaps exist in their strategy that you can fill. There are five metrics that actually move the needle in a benchmarking analysis.

    Engagement Rate

    Follower counts are the most visible metric and the least useful for benchmarking. A brand with 50,000 followers and 0.2% engagement is reaching fewer people effectively than a brand with 8,000 followers and a 3% engagement rate. Engagement rate gives you a normalized measure of how actively an audience is responding to content. For Instagram, the industry average sits at roughly 0.47% for business accounts, according to Rival IQ’s 2025 Social Media Industry Benchmark Report. Facebook averages significantly lower. When you see competitors consistently outperforming the industry average, that is a signal worth investigating. When they are underperforming it, that is a gap you can fill.

    The problem with most social media metrics is that raw numbers hide the real story. Engagement rate, normalized by follower count, is one of the few metrics that cuts through the noise.

    Posting Frequency and Consistency

    Algorithms on every major platform reward consistency. A brand that posts three times per week every single week will typically outperform a brand that posts ten times one week and then goes quiet for two. Benchmarking posting frequency helps you answer a key question: are you showing up at the same pace as the brands competing for the same audience? If competitors are posting five times per week and you are posting twice, the algorithm is giving them a systematic advantage.

    Follower Growth Rate

    Total follower count is a lagging indicator. Growth rate tells you momentum. If a competitor is growing their Instagram following by 4% per month and you are growing at 1%, that gap will compound quickly. Track growth as a percentage, not a raw number. A brand adding 500 followers a month from a base of 5,000 is growing at 10% monthly. A brand adding 5,000 followers from a base of 500,000 is growing at 1%. The first brand is winning, even though the raw numbers say otherwise.

    Content Format Mix

    Platforms shift what they reward over time. In 2024, short-form video dominated almost every feed. By mid-2026, carousels have made a significant comeback on Instagram, and YouTube’s algorithm is weighting community posts more heavily alongside Shorts. Look at what format mix your competitors are using and which format generates the most engagement within that mix. If they are getting 3x more engagement on video than on static posts, and you are still leading with static images, that is an actionable insight.

    Response Time and Community Activity

    This one gets overlooked almost universally. How quickly a brand responds to comments, questions, and DMs signals how seriously they treat their community. Slow response time trains audiences to stop engaging. If your competitors are replying to comments within hours and you are responding three days later – or not at all – you are not just losing engagement. You are losing the trust that turns followers into buyers.

    Delphi, Bluekona AI mascot

    Benchmarking without context is just professional envy dressed up in a spreadsheet. Pick the right peers and the data actually tells you something useful.

    Where to Find Competitor Data

    The best starting tools for competitive social media benchmarking are free and built directly into the platforms. You do not need a premium subscription to get started. What you need is a structured process for gathering information consistently.

    What the Platforms Tell You for Free

    Facebook and Instagram let you see a competitor’s posting frequency, page transparency information, and top-performing ads if they are running paid content via the Meta Ad Library. LinkedIn company pages show follower counts and recent post activity. YouTube surfaces subscriber counts, total views, and posting history directly on any channel’s About tab. For Instagram specifically, look at the engagement on each individual post. Count comments, note whether the brand is responding to them, and observe which content types are generating the most saves and shares.

    Manual Spot Checks That Actually Work

    Pick two or three direct competitors and spend around thirty minutes each month doing a structured spot check. Note their last ten posts and the engagement each one received. Track any new content formats they have introduced, the topics they are covering that you are not, and how they frame their calls to action. Build a simple spreadsheet to track this over time. Even a basic month-to-month comparison will reveal patterns that meaningfully inform your own strategy.

    The Ceiling of DIY Benchmarking

    Manual benchmarking gives you snapshots, not trends. You can see what a competitor posted this week but you cannot easily see how that compares to their performance six months ago. You also cannot benchmark across multiple platforms simultaneously without either the right tool or a significant investment of time. This is where the gap between manual effort and AI-powered auditing becomes most visible.

    0.47%
    Average Instagram engagement rate for business accounts in 2025
    72%
    Marketers who say competitive benchmarking meaningfully improves their content strategy decisions
    3x
    More consistent engagement seen by brands posting on a regular weekly schedule vs. sporadic bursts

    Platform Benchmark Reference

    Platform Avg Engagement Rate Recommended Posting Frequency Top Format in 2026 Ease of Benchmarking
    Instagram 0.47% 4 to 7 times per week Reels and Carousels Medium
    Facebook 0.12% 3 to 5 times per week Short Video Easy
    YouTube 2.1% * 1 to 3 times per week Long-form and Shorts Medium
    Threads 0.9% Once to twice daily Text Threads and Images Easy

    * YouTube engagement is measured as combined likes and comments relative to views, not follower count. Benchmark figures sourced from Rival IQ 2025 and Sprout Social 2025 industry data.

    The Benchmarking Trap You Need to Avoid

    The single most common benchmarking mistake is comparing yourself to brands at a completely different stage of growth. A local bakery should not benchmark against national QSR chains. An independent fitness coach should not compare follower growth rates against a VC-backed fitness app. These comparisons will either create false security or demoralize you with an impossible gap.

    The Right Peer Group

    Find two to five brands that are genuinely comparable – similar size, similar audience, similar growth stage, and similar product or service category. Your benchmark group should be aspirational but not fictional.

    This same logic applies to metrics. If a competitor has a massive legacy following built over five years, comparing your month-over-month follower growth to theirs will tell you nothing useful. What you can compare is their engagement rate, their content format mix, and their community response time – metrics that are independent of account age and legacy size. Running a proper social media SWOT analysis alongside your benchmarking exercise helps you put the competitive data in context and identify where you actually have an edge.

    Setting Benchmarks That Are Actually Useful for Your Stage

    Before you benchmark against competitors, run an audit of your own performance first. Your historical data is your most honest baseline. Where were you three months ago on engagement rate? What about six months ago on follower growth? Comparing your current performance to your own past performance gives you a growth trend line. Comparing that trend to comparable competitors shows you whether your growth is keeping pace with the market, falling behind, or actually pulling ahead.

    If you have not audited your own accounts recently, that is the right starting point. Bluekona’s audit tools walk through your Instagram performanceFacebook page metrics, and YouTube data in a single session, giving you the baseline numbers you need before any competitive comparison makes sense.

    Delphi, Bluekona AI mascot

    The right benchmark is the brand that is one step ahead of where you are right now. Not the brand you aspire to be in five years. Not the market leader with a full marketing team. The brand just above your current waterline.

    Benchmark Right
    • Pick 3 to 5 brands at a similar follower count and growth stage
    • Track the same 5 metrics each month for consistency
    • Focus on trends over time, not single-data-point snapshots
    • Use findings to set specific 30 to 90 day improvement targets
    • Audit your own historical data first before comparing externally
    Common Mistake
    • Compare against market leaders with large teams and legacy audiences
    • Check a competitor once, then assume their numbers stay static
    • Treat follower count as the primary success metric
    • Collect benchmarking data but never convert it into a specific action
    • Benchmark one platform while ignoring how competitors perform across all of them

    How AI Changes the Benchmarking Game for SMBs

    Manual benchmarking is better than no benchmarking at all. But it has real limits. It is time-consuming, it gives you incomplete snapshots rather than full trend lines, and it becomes increasingly impractical as you try to track multiple platforms and multiple competitors simultaneously. Most founders and small-team marketers find that manual benchmarking gets deprioritized within a month or two because it simply does not fit into an already packed week.

    AI-powered social media auditing tools change the equation. Instead of manually checking competitor pages and logging data into spreadsheets, you get cross-platform performance data surfaced automatically, with pattern recognition layered on top. The AI does not just show you numbers – it tells you what the numbers mean relative to your own performance trend and relative to what similar brands are doing. That is the difference between a data export and an insight you can actually act on.

    More importantly, AI benchmarking runs continuously. You are not working from a snapshot taken on one Monday in March. You are working from a living picture of your competitive landscape that updates as the market shifts. This matters because social media moves fast. A content format that was underperforming three months ago might be the platform’s current favorite. A competitor that was stagnant might have pivoted and is now growing at a pace that warrants attention. The brands that catch those shifts early are the ones that track content performance across platforms without waiting for a quarterly review cycle to notice what changed.

    Delphi, Bluekona AI mascot

    Your best benchmark is your own performance from 90 days ago. External data just tells you whether you are swimming faster or slower than the brands around you. Both answers are useful.

    From Benchmark to Action

    A benchmarking exercise that ends with a spreadsheet is a waste of time. The goal is to convert insights into a specific list of changes you are going to make in the next 30 days. If benchmarking reveals that your engagement rate is below the industry average, the next question is why. Look at your content format mix. Look at how you are opening your posts – the first sentence of copy determines whether someone stops scrolling or keeps moving. Look at whether you are posting consistently or going quiet for stretches that train the algorithm to deprioritize your account.

    If benchmarking reveals a competitor is growing followers twice as fast as you, look at what they are doing that you are not. Are they collaborating with micro-influencers? Are they posting at a different cadence? Are they actively responding to comments in a way that drives further conversation? The benchmark gives you the “what.” The audit gives you the “why.” The action plan gives you the path forward. Bluekona is built to help you run all three steps without needing a dedicated analyst sitting between you and the data.

    Start Here This Week

    Pick two direct competitors at a similar growth stage. Spend 20 minutes checking their last 10 posts across your shared platforms. Note engagement rates, format mix, and response activity. Then compare those numbers to your own last 10 posts. That gap is your first actionable benchmark.

    Social media growth without competitive context is just hope with a posting schedule. When you know how you stack up, you can make decisions that are grounded in data rather than intuition. And when you run that benchmarking process through an AI-powered audit rather than manually, you get a view that is faster, more complete, and more useful for the volume of decisions a small team needs to make every week.

    Social media growth without competitive context is just hope with a posting schedule. When you know how you stack up, you can make decisions that are grounded in data rather than intuition. And when you run that benchmarking process through an AI-powered audit rather than manually, you get a view that is faster, more complete, and more useful for the volume of decisions a small team needs to make every week.

    See How You Stack Up Against Competitors. Run a free AI-powered social media audit across YouTube, Instagram, Facebook, and Threads. Get the benchmarking data you need without the manual work.

  • Your Threads Strategy Is Missing This One Thing (And Your Audit Will Prove It)

    Your Threads Strategy Is Missing This One Thing (And Your Audit Will Prove It)

    Here’s a quick question. When did you last post on Threads? If you had to think about it for more than three seconds, you already know something is off. Most SMB owners have the same Threads story. They signed up, posted a few times, noticed nothing much happened, and quietly moved on. The account exists. It just doesn’t do anything. The platform isn’t the problem. The strategy is.

    400M+
    Monthly active users by Aug 2025
    6.25%
    Median engagement rate, vs 3.6% on X
    127.8%
    YoY growth in daily active users through June 2025

    Threads crossed 400 million monthly active users by August 2025, up from 275 million just eight months earlier. Daily active users surpassed X on mobile for the first time in 2025. This is not a dying platform. This is a platform where most brands are simply showing up wrong. The thing they’re missing isn’t more content. It’s conversation.

    Threads Is Growing Fast – But Most Brands Are Treating It Like a Leftover

    When Threads launched in 2023, a lot of brands treated it as an Instagram overflow channel. Post the same content, same captions, same graphics. What happened, mostly, was nothing.

    Threads has its own tone, its own rhythm, and its own algorithm. Brands that mapped Instagram habits onto it found that polished graphics underperformed. Scheduled batches of promotional content got ignored. Follower counts crept upward without any meaningful engagement behind them.

    The platform rewards something that most social media workflows aren’t built to produce at all.

    Delphi, Bluekona AI mascot

    Most brands treat Threads like a party where they post a flyer on the door, stand in the corner checking their phone, and then wonder why nobody came over to talk. Showing up is not a strategy. Showing up and saying something is.

    The One Thing Most Threads Strategies Are Missing

    The missing piece isn’t a content calendar, a hashtag strategy, or better visuals. It’s replies. Specifically, replies per post – which the Threads algorithm weights more heavily than any other signal as of mid-2025, according to RecurPost and Metricool.

    The gap in plain terms – Most brands treat Threads like a broadcast channel. They post, move on, and check back in a week. The algorithm sees zero conversation activity and stops pushing the content beyond existing followers. The gap is not the quality of what you post. It’s what happens after.

    Why the Algorithm Weights Replies So Heavily

    By mid-2025, Meta shifted the For You feed toward a recommendation-driven model that surfaces content based on engagement signals, topic relevance, and conversation quality rather than follower count. This is significant for small brands. A brand with 500 followers can reach thousands of people if the conversation on their post is active enough.

    The flip side is equally true. A brand with 50,000 followers and a ghostly comment section will reach almost nobody outside their existing audience.

    What Brands Actually Get Wrong When They Show Up on Threads

    Beyond the reply issue, there’s a tone problem. Threads rewards candid, direct, slightly unpolished communication that feels like a person wrote it rather than a content team. Over-produced content and generic brand-voice copy underperform consistently.

    If you want to understand what hooks actually work in that first moment of attention, the same principle applies on Threads as anywhere else – read more in our breakdown of the first 3 seconds of a social media post.

    What doesn’t work

    Repurposed Instagram graphics, scheduled promotional captions, one-way announcements with no question or hook, link posts that push users off-platform.

    What works

    Direct opinions, industry observations, questions that invite pushback, behind-the-scenes text posts, replies to niche accounts with real audiences.

    Threads does not care how many times you posted this week. It cares how many conversations you started. There is a significant difference between those two things, and your reach will tell you exactly which one you have been doing.

    Delphi, Bluekona AI mascot

    What a Threads Audit Actually Reveals

    Most brands assume they know what they’re doing on Threads. The audit usually reveals something more honest, and occasionally more humbling. The gap between what you think your posting cadence looks like and what the data actually shows tends to be wide.

    If you’ve wondered whether an AI-powered audit is faster and more accurate than pulling the data yourself, we covered that comparison in depth in this breakdown of AI vs manual social media audits.

    Posting Cadence and Consistency Gaps

    The first thing an audit surfaces is your actual posting frequency versus what you remember posting. Most accounts think they post more often than they do. Significant gaps – sometimes weeks without activity – reset any momentum the algorithm had built. Consistency beats volume. Posting twice a week reliably outperforms ten posts in one week followed by three weeks of silence.

    Content Format Performance

    Threads supports text posts, photos, links, and videos. They don’t all perform equally. Most SMBs lean too heavily on link posts, which get the least traction because they ask users to leave the platform.

    Format Engagement Performance Reach Impact
    Photos Best performer 60% above text-only
    Text posts Solid Good when conversational
    Videos Variable Strong when short and native
    Link posts Lowest 37% below photos

    WebFX, 2025 Threads Marketing Benchmarks

    Reach vs Engagement Disconnect

    This is the finding that surprises people most. It’s possible to have a healthy engagement rate on Threads and still have flat or declining reach. Strong likes and reposts from existing followers keep your rate looking decent. But if nobody outside your circle is continuing conversations you started, the algorithm won’t push your content to new audiences. Reach growth on Threads requires outbound conversation activity, not just good content waiting to be noticed.

    Delphi, Bluekona AI mascot

    The audit does not lie. Your engagement rate looks fine because your existing followers are loyal. Your reach is flat because you have not talked to anyone new. Those are two very different problems, and only one of them shows up when you just check your notifications.

    What a Winning Threads Presence Looks Like for an SMB

    Tone and Voice – Personality Over Polish

    Threads users respond to content that sounds human. Shorter sentences, direct opinions, questions, observations, and the occasional take that invites pushback. You don’t need a design team or a videographer. You need a point of view and the willingness to express it. A local bakery posting “Sourdough starter that’s three years old hits different in winter. Anyone else notice this?” will outperform a branded promotional graphic every single time.

    The Reply Strategy That Expands Your Reach

    The most efficient thing you can do on Threads isn’t post more. It’s reply more. Reply to your own posts when people comment. Reply to posts from accounts in your niche. Start conversations in the replies of larger accounts whose audiences overlap with yours.

    The 15x reach multiplier – Companies that enable team members to engage with branded content on Threads see 10 to 15 times the organic reach of brand account posts alone, according to inBeat Agency’s 2026 research. Even solo founders who block 10 to 15 minutes daily for Threads replies – not posting, just responding – tend to see measurable reach growth within two to three weeks.

    Cross-Platform Leverage From Your Instagram and Facebook Presence

    If you already have an active Instagram or Facebook account, Threads has a structural advantage built in. Meta’s ecosystem makes cross-promotion between platforms easier than anywhere else. Your existing audience can follow you on Threads with minimal friction, and Meta’s infrastructure treats activity across all its platforms as connected signals.

    For SMBs that have spent years building a Facebook or Instagram following, Threads is one of the highest-leverage organic platforms available right now. The foundational work is already done. You can see how this connects to a broader cross-platform approach in our Facebook Business Page audit guide, which covers what cross-platform data reveals when you audit together rather than in silos.

    How to Use Your Audit Results to Fix It

    A complete Threads audit should surface five things. Your posting frequency and consistency over the past 90 days. Your content format breakdown and how each format performs for your specific account. Your average engagement rate versus platform benchmarks. Your reply rate when people engage with you. And how your reach has trended over time.

    From there, the fix is straightforward. Inconsistent posting? Set a minimum of two posts per week and hold it before adding more. Link posts dragging engagement down? Replace them with photos or plain-text observations. Reply rate near zero? Block fifteen minutes a day for engagement only – no posting, just responding.

    Once you know which content formats are working on Threads, the next step is to build those formats into a repurposing workflow so the same insight can work across your other platforms. Our guide on measuring the ROI of content repurposing walks through how to connect those dots, and our social search strategy and repurposing workflows post shows what that looks like in practice.

    Act before the window closes – Meta launched Threads ads globally in January 2026. When platforms move from growth to monetization, organic reach tightens in the months that follow. Brands with strong engagement signals baked in now will hold their reach better than those who wait. The window is still open. It won’t stay that way.

    BluekonaAI runs cross-platform audits across Threads, Instagram, Facebook, and YouTube, surfacing your actual cadence gaps, format performance, and reach trends in minutes.