Category: Audit

  • What Is a Content Performance Audit? (And How Is It Different From a Social Media Audit)

    What Is a Content Performance Audit? (And How Is It Different From a Social Media Audit)

    Two agencies pitch the same DTC brand in the same week. One deck is titled “Social Media Audit.” The other says “Content Performance Audit.” Open both PDFs and, for the first ten pages, you’d struggle to tell them apart: follower graphs, engagement rates, a heatmap of best posting times, a competitor comparison slide with somebody else’s logo blurred out.

    Then you hit the last section, and only one of the two decks tells you which post actually put money in the bank.

    That’s the whole difference. Not the cover page, not the vendor’s tagline, not how confidently the salesperson says “performance.” It’s whether the report was built to answer “how’s our presence doing” or “which content made us money.” Those are different questions, they need different data, and if your team has been treating the two audits as interchangeable, you’ve probably been making budget calls off the wrong one.

    Two Terms, Two Very Different Reports

    A social media audit and a content performance audit look similar from a distance. Open either report and the difference becomes obvious fast.

    What a social media audit actually measures

    A social media audit is the older, more established category. It reviews your entire presence on a platform, not just individual posts. That usually covers your profile setup, your posting cadence, your follower growth, your engagement rate compared with competitors, and whether your branding stays consistent from one platform to the next.

    Think of it as a checkup for your presence as a whole. It tells you whether your bio is optimized, whether you are posting often enough, and whether your account looks healthy next to the accounts you compete with. It is genuinely useful for catching gaps like an outdated profile photo, an inconsistent posting schedule, or a competitor quietly pulling ahead on a platform you have been ignoring.

    What a content performance audit actually measures

    A content performance audit asks a narrower question, and for a revenue-focused team, a far more useful one. Instead of reviewing your presence, it reviews your content piece by piece and asks which pieces are actually driving business outcomes.

    That means looking past likes and views to whether a product mentioned in a video is tagged, whether that tag still works, and whether clicks on it are turning into sales. A content performance audit treats every video, post, or Reel as its own small revenue channel worth grading individually, rather than folding everything into one account level score.

    Why the Mix-Up Costs DTC Teams Real Money

    This is not just a semantic argument. Most content teams already track plenty of numbers. The problem is which numbers. Eighty seven percent of content teams track traffic, but only 31 percent track revenue attribution, according to Digital Applied’s 2026 Content Marketing Statistics report. That gap explains why so many marketing teams can point to a growing follower count and still struggle to justify their budget in a leadership meeting. For a deeper look at why engagement numbers alone keep failing marketing teams in that exact meeting, see our piece on the problem with social media metrics.

    Sixty one percent of marketers say they struggle to connect content metrics to revenue outcomes, per the same Digital Applied research. A social media audit, run on its own, tends to reinforce that gap rather than close it. It can tell you engagement rose 12 percent this quarter. It cannot tell you whether that lift came from content that sold anything.

    Quick Takeaway

    Teams that can prove content ROI to leadership see 3.1 times higher budget growth the following year, according to Digital Applied. That single number is probably the strongest argument for running a content performance audit that most DTC teams have never heard.

    Content Performance Audit vs Social Media Audit

    Here is the difference laid out side by side, based on what each audit actually reviews and the question each one is built to answer. Our post on the recognition between content and conversion goes deeper on why that revenue column matters so much.

    Category Social Media Audit Content Performance Audit
    Scope Account level presence Individual piece of content
    Main Metrics Reach, engagement rate, follower growth Tag coverage, attribution, revenue per post
    Question Answered Is our presence healthy Which content is actually making money
    Best For Presence Check Revenue Check
    Typical Cadence Quarterly Monthly

    What a Content Performance Audit Actually Looks At

    Product and affiliate tag coverage

    A content performance audit starts by checking whether every product or brand mention inside a piece of content actually has a working tag attached to it. A video can rack up hundreds of thousands of views and still generate close to nothing if the product shown on screen was never tagged, or if the tag points to a broken link. This is the exact gap covered in our guide on why your YouTube videos are leaking revenue, and it is usually the single biggest fix a brand finds in its first audit.

    Content-to-revenue attribution

    Tag coverage only matters if it connects to an actual sale. The second layer of a content performance audit traces each tagged click through to a purchase event, so a brand can see not just that a link was clicked, but that the click turned into revenue. This is the core idea behind content-to-revenue attribution, which our content-to-revenue attribution guide for DTC teams breaks down in more detail. Once that link exists, a content calendar stops being built around what got the most views and starts being built around what actually sold something.

    Cross-platform performance, not single-channel vanity metrics

    Most DTC brands are not living on a single platform. A content performance audit pulls YouTube, Instagram, Facebook, and Threads into one place instead of forcing a marketing manager to reconcile four separate dashboards by hand. Shoppers already behave this way, needing roughly 11 touchpoints across channels before buying, and brands with mature cross-channel measurement see 3.2 times higher marketing-attributed revenue growth than brands still relying on single-channel reporting, according to Admetrics’ 2026 cross-channel marketing research.

    Eighty seven percent of teams track traffic and thirty one percent track revenue. The other fifty six percent are just really good at watching a number go up for no reason.

    Delphi, Bluekona AI mascot

    Which One Does Your Team Actually Need

    Most DTC teams do not need to pick one audit and abandon the other forever. They need to know which question they are actually trying to answer this quarter.

    Run a social media audit when the question is about presence, whether your profiles are set up correctly, whether your posting cadence keeps pace with competitors, or whether your branding holds together across platforms. It is the right tool for a quarterly health check.

    Run a content performance audit when the question is about money, which videos or posts are actually driving sales, where revenue is leaking through broken tags, and what a leadership team should hear in a report that ties content back to the P&L. Our guide on how to report social media results to leadership walks through exactly what that report should look like once the audit data exists.

    Works Well

    Matching the Audit to the Question

    Running a content performance audit when the goal is proving revenue impact, and a social media audit when the goal is checking presence and consistency.

    Falls Short

    Running One Audit for Every Question

    Using a single generic report to answer both presence questions and revenue questions, then feeling disappointed when it does neither one well.

    A useful rule of thumb, if the meeting you are preparing for is with your community manager, a social media audit probably has what you need. If the meeting is with your CFO, you need a content performance audit.

    Running a Content Performance Audit Without Hiring an Analyst

    Doing this by hand is possible for a single creator posting on one platform. It stops being realistic the moment a brand is running content across three or four platforms with more than a couple of people touching the calendar. That is usually the point where a marketing manager ends up manually copying click counts between five dashboards into one spreadsheet, a problem covered in detail in why manual social media audits are wasting your time.

    Rising costs and growing tech complexity are already pushing DTC brands in this direction industry wide. A 2026 survey of 134 DTC brands and agencies by Digiday and Klaviyo found the industry shifting back toward unified, revenue-based measurement instead of optimizing each channel in isolation, because reconciling separate tools channel by channel stopped scaling.

    An automated content performance audit does that reconciliation work for you, pulling tagged product data, attribution, and cross-platform performance into a single view. Instead of spending a week each month assembling the data, a marketing manager spends that time acting on it, which is the entire point of running an audit in the first place.

    Frequently Asked Questions


    Is a content performance audit just a rebranded social media audit?

    No. A social media audit reviews your account level presence. A content performance audit reviews individual pieces of content against tagging, attribution, and revenue, a narrower and more commercially focused question.

    Do I need both types of audit?

    Most growing DTC brands eventually run both, a social media audit for quarterly presence checks and a content performance audit for ongoing revenue and monetization decisions.

    How often should a content performance audit run?

    Monthly is a reasonable cadence for a brand publishing regularly across multiple platforms, since tags break and attribution windows shift faster than most teams expect.

    Can a content performance audit replace Google Analytics or Shopify reporting?

    Not entirely. It complements them by connecting the content side of the funnel, tags, clicks, and attribution, back to the purchase data those platforms already track.

    What is the fastest way to see if my brand needs one?

    If nobody on your team can name which specific video or post drove your last ten sales, that is a strong signal a content performance audit would surface something your current reporting is missing.
    See which of your posts are actually driving revenue.

    Run a free content performance audit across YouTube, Instagram, Facebook, and Threads in minutes.

    Run Free Audit
  • How to Report Social Media Results to Leadership Without Losing the Room

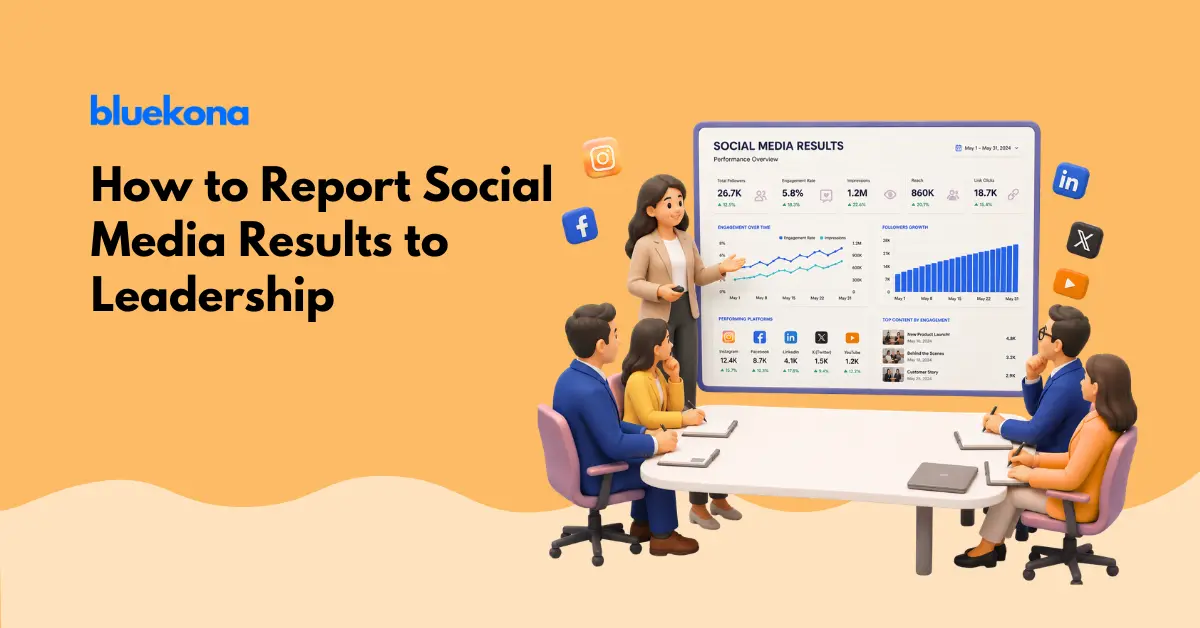
    How to Report Social Media Results to Leadership Without Losing the Room

    You spend an hour every month pulling numbers into a slide deck. Reach is up. Engagement is up. Followers are up. Then you present it to your founder or your leadership team, and the room goes quiet in the wrong way. Nobody argues with the numbers. Nobody looks convinced by them either.

    That gap is one of the most common frustrations in marketing right now. 65% of leadership want to see direct connections between social campaigns and business goals, and 52% want quantifiable cost savings across their channels. Your report might be perfectly accurate. It might just be answering questions nobody in that room is actually asking.

    This guide walks through how to build a social media report leadership actually trusts, one that speaks in business outcomes instead of platform metrics, and how tools like Bluekona’s AI powered audits can do most of that translation work for you automatically.

    65%
    of leadership want social campaigns tied directly to business goals
    Verloop, August 2025
    30%
    of marketers believe they can actually measure social media ROI
    Statista, May 2025
    21%
    rise in board pressure on marketing leaders to prove ROI since 2023
    The CMO Survey, Spring 2025

    Why Your Leadership Report Keeps Falling Flat

    Most social media reports fail for a simple reason. They are written by a marketer, for a marketer. Every number on the page makes sense to the person who built the dashboard. Almost none of it maps cleanly onto the questions a founder or a CFO is actually holding in their head walking into that meeting.

    The metrics you track aren’t the metrics they care about

    Reach, impressions, and engagement rate are genuinely useful. They tell you whether your content strategy is working from one week to the next. They tell your leadership almost nothing about whether the marketing budget is paying for itself. When a report opens with platform level metrics, it is speaking a language leadership never agreed to learn. Our piece on the problem with social media metrics goes deeper into why this disconnect exists in the first place, and it is worth reading before you build your next report.

    The attribution gap everyone feels but nobody names

    Nearly every executive believes social media influences revenue somewhere along the funnel. Very few of them can point to the exact number. 97% of leaders believe they can communicate social media’s value internally, yet only 30% of marketers believe they can actually measure social ROI, according to a Statista survey. That gap between belief and proof is the whole problem. Believing something matters is not the same as proving it, and leadership knows the difference even when they cannot articulate it.

    Delphi, Bluekona AI mascot

    Everybody believes social media works. That’s cute. Show me the number or it did not happen.

    What Leadership Actually Wants to Hear

    Leadership is not asking you to abandon social media metrics. They are asking you to translate them. A founder does not need to know your share to reach ratio. They need to know whether the marketing team is moving the business forward, and by roughly how much.

    Business outcomes over vanity metrics

    Followers, likes, and impressions are participation numbers. They describe activity, not impact. Business outcomes such as qualified leads generated, website traffic from social, revenue assisted by social touchpoints, and customers retained through social support are the numbers that connect your work to what leadership actually manages toward. Pressure to make that connection keeps climbing. The CMO Survey found that board level pressure on marketing leaders to prove ROI rose 21% between 2023 and 2025, with pressure from the CFO alone climbing 52% in the same period.

    The three questions every executive is silently asking

    Every leadership report should answer three questions, whether or not leadership says them out loud. Is this working, translated into numbers a P&L would recognize. Is this worth what we are spending on it, compared to other channels. What happens to the business if this budget got cut in half next quarter. If your report cannot answer those three questions on the first page, everything else you present is just supporting detail nobody asked for.

    The Report Structure That Actually Lands

    The single biggest change you can make to a leadership report has nothing to do with which metrics you include. It is the order you present them in.

    Lead with the business question, not the platform breakdown

    Open with the outcome, then support it with the platform data, not the reverse. Start the report with a single sentence such as “social media contributed to 40 qualified leads and an estimated portion of pipeline this quarter,” then use the rest of the page to show your work. Most reports do this backwards, opening with an Instagram summary, then a Facebook summary, then a LinkedIn summary, and only mentioning business impact on the last slide if there is time left. Leadership checks out long before that slide arrives.

    One page, three numbers, one story

    Discipline is the differentiator here. Pick three numbers that matter most this period, not fifteen. Wrap them in a single narrative about what changed and why. A report with three well chosen numbers and a clear story beats a report with thirty numbers and no throughline, every single time.

    The One Page Rule

    If your leadership report cannot fit on one page with room to breathe, you have not finished editing it yet. Cut until the story is obvious, then stop.

    One page. Three numbers. One story. If your report needs its own table of contents, you already lost the room.

    Delphi, Bluekona AI mascot

    Where Bluekona does the translation work for you

    Pulling this structure together manually every month means logging into four different platform dashboards, exporting spreadsheets, and reconciling numbers that were never designed to sit next to each other. This is exactly the gap Bluekona was built to close. A cross-platform social media audit from Bluekona pulls your YouTube, Instagram, Facebook, and Threads data into one place and applies AI generated insights that already speak in outcomes rather than raw platform metrics. Instead of spending an afternoon reconciling numbers, you get a business ready summary you can drop straight into your leadership report, along with the supporting detail if anyone asks for it. You can also see how our guide on scaling social media strategy with AI connects to this same idea of letting automation carry the reporting workload.

    Turning Raw Metrics Into an Executive Narrative

    Once you have your three numbers, the next skill is translation. This is where most reports either win the room or lose it entirely.

    From engagement rate to pipeline signal

    Engagement rate on its own means little to leadership. Reframed as a pipeline signal, it becomes useful. Instead of reporting “engagement rate was 4.2% this month,” report “content that answered a specific customer question generated three times the saves and drove a measurable increase in demo requests.” The number is the same underlying data. The story is what makes it land. Our post on the link between content and conversion breaks down how to make that connection credibly instead of stretching the data further than it can go.

    From reach to brand equity, in plain language

    Reach and impressions are not worthless, they are just misunderstood at the leadership level. Reframe them as brand equity building, the slow accumulation of familiarity and trust that eventually shortens your sales cycle. Say it plainly. “Our reach growth this quarter means more of our target buyers recognize the brand before a sales conversation ever starts.” That sentence does more work in a leadership meeting than any reach chart ever will.

    A Sample Monthly Leadership Report Template

    Here is a simple structure you can adapt starting with your next reporting cycle. It leads with outcomes, keeps supporting metrics visible, and flags status clearly so leadership can scan it in under a minute.

    MetricWhat It Tells LeadershipStatus
    Social assisted revenueDirect dollar contribution from social touchpointsOn Track
    Qualified leads from socialVolume feeding directly into the sales pipelineWatch
    Cost per social acquired customerEfficiency compared to paid alternativesOn Track
    Branded search volumeLong term brand equity buildingAt Risk

    What to include, what to cut

    Include anything that ties back to revenue, pipeline, retention, or brand equity. Cut anything that only measures activity, such as number of posts published or hours spent on content creation. Those numbers matter to you as a manager. They mean nothing to someone deciding whether to fund next quarter’s budget.

    Common Mistakes That Undermine Your Credibility

    A few habits quietly damage trust in your reporting over time, even when the underlying work is strong.

    Strong Report
    • Opens with one clear business outcome
    • Three metrics maximum on the summary page
    • Plain language, no platform jargon
    • Flags risk areas honestly, before leadership asks
    Weak Report
    • Opens with a platform by platform breakdown
    • Fifteen or more metrics with no clear priority
    • Heavy jargon assumed to be self explanatory
    • Only positive numbers shown, risk buried or skipped

    Overloading the room with data

    More data does not build more trust. It usually does the opposite. When leadership sees twenty charts, they assume you are hiding the real story behind volume. A tight report signals confidence. A dense one signals uncertainty, even when the underlying numbers are good.

    Reporting activity instead of outcomes

    Number of posts, number of stories, number of hours spent editing video, these describe effort, not results. Leadership funds results. If your report leans heavily on activity metrics, it reads as an excuse for a missing outcome rather than evidence of one.

    Building a Reporting Cadence Leadership Trusts Over Time

    One good report earns attention. A consistent cadence earns trust. Report on the same three to five outcome metrics every single cycle so leadership can see trendlines, not just snapshots. Flag risk honestly and early, since leadership forgives a missed number far more easily than a surprised one. And keep the format identical every time. Predictability is part of what makes a report feel credible, because leadership starts to recognize the pattern and trust what sits inside it.

    None of this requires a new dashboard built from scratch or a data analyst on staff. It requires a consistent source of truth across every platform you run, translated into language that matches how your leadership actually thinks about the business.

    Delphi, Bluekona AI mascot

    Let Bluekona chew through the platform data so you walk into that meeting looking like the smartest person in it. I will take the credit later.

    If you are rebuilding your reporting process this quarter, start with a single cross platform audit. Seeing your YouTube, Instagram, Facebook, and Threads performance translated into one business ready summary is usually the fastest way to spot which three numbers deserve the spotlight in your very next leadership meeting. Our guide to tracking content performance without a spreadsheet pairs well with this process if you want to go deeper on the mechanics.

  • How Agencies Can Use AI Audits to Win and Retain More Clients

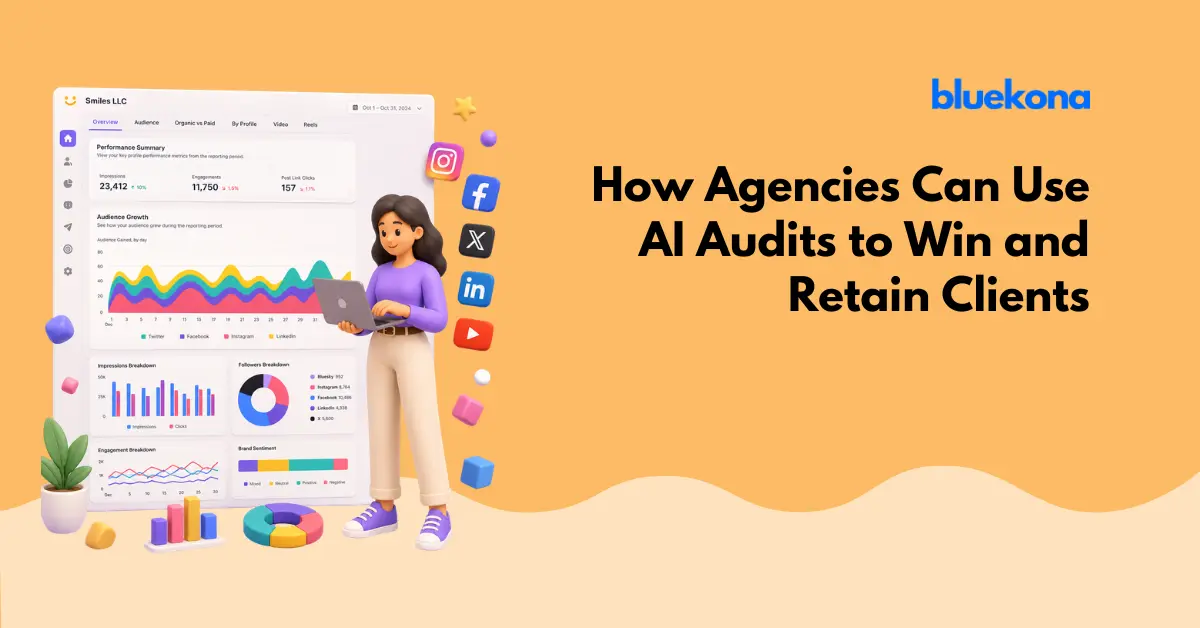
    How Agencies Can Use AI Audits to Win and Retain More Clients

    Client churn is the quiet tax every agency pays. In 2026, that tax has gotten steeper. Social media agencies are losing clients faster than almost any other service specialization, and the reasons are shifting under everyone’s feet. Brands are pulling creative work in house. AI tools promise to make execution cheap and replaceable. And clients are leaving over dissatisfaction that agencies rarely see coming until the cancellation email arrives.

    The agencies pulling ahead this year are not the ones running from AI. They are the ones using it in the one place it actually protects the relationship, the audit. A well-run cross-platform audit does something a status report never can. It proves strategic value, catches problems before they turn into cancellations, and gives an account manager a real reason to walk back into a client’s inbox with something worth reading.

    This piece breaks down why agencies are churning faster in 2026, why not every AI use case pays off the same way, and how to build audits into a retention engine your clients actually notice.


    Why Agencies Are Losing Clients Faster Than Ever in 2026

    Social media agencies now face 46% annual client churn, second only to paid media agencies at 49%, according to Focus Digital’s 2026 Agency Churn Report. That number sits inside a bigger shift. Two forces are driving it, and most agencies are only prepared for one of them.

    46%
    Annual churn for social media agencies, second highest of any specialization
    Focus Digital, 2026 Agency Churn Report
    48%
    Of departing clients cite dissatisfaction with delivery, up 14 points year over year
    Focus Digital, 2026 Agency Churn Report
    34%
    Lower annual churn for agencies using AI-powered churn prediction in year one
    Focus Digital, 2026 Agency Churn Report

    The In-House Threat

    Nearly a third of brands, 32%, expect to bring all their creative work in house within the next 12 months, according to the same Focus Digital report. That threat lands hardest on agencies that position themselves as execution shops. If your value proposition amounts to “we post content and send a recap,” a marketing hire with an AI subscription can replicate most of that within a few months. Agencies that survive this shift are the ones clients see as strategists, not vendors.

    The Delivery Gap Nobody Sees Coming

    The more surprising number is this one. 48% of clients who left an agency in 2026 cited dissatisfaction with delivery as the reason, up 14 percentage points from the year before. Agencies, meanwhile, ranked delivery dissatisfaction seventh on their own internal list of churn risks. That gap between what clients feel and what agencies notice is where most preventable churn happens.

    The clients most likely to leave are not complaining loudly. They are quietly comparing your monthly recap to what an AI tool could generate for a fraction of the cost.

    Not All AI Use Is Equal

    Agencies rushed into agentic AI over the last 18 months, and the payoff has been wildly uneven. A 2026 survey of 250 marketing and development agencies by Digital Applied found that audit-style workflows return an 11.4x median ROI, the highest of any agentic use case measured. Client report drafting, the most common agency AI use case, returned just 1.6x, the lowest of the seven workflows studied.

    The gap makes sense once you think about what each workflow actually replaces. Report drafting automates work that was already low value to the client. Audits replace hours of senior strategist time spent analyzing what is genuinely working, and clients pay full rate for that kind of insight. One workflow makes an agency look more replaceable. The other makes it look indispensable.

    Audit-led AI use

    Diagnosis clients pay for

    Surfaces insights across platforms that clients cannot get on their own, gives account managers something new to say every month.

    11.4x median ROI
    Report-only AI use

    A recap clients already skim

    Automates a summary the client barely reads and changes nothing about the strategy underneath it.

    1.6x median ROI
    Delphi, Bluekona AI mascot

    Nobody canceled a retainer because the report was not pretty. They canceled because the report told them nothing they didn’t already know.

    How Cross-Platform Audits Become a Retention Engine

    A cross-platform audit, one that pulls signal from YouTube, Instagram, Facebook, and Threads into a single set of AI-generated recommendations, does three jobs a status report never will. It wins the pitch. It catches churn before it starts. And it proves an agency is directing strategy, not just executing tasks.

    Winning the Pitch

    Prospects rarely choose an agency based on a proposal deck alone. A live audit of their current social presence, run before the first call, gives a team something no competitor pitch has, specific proof that the agency already understands the business. Manual audits take days and rarely survive past the first draft. An AI-generated audit takes minutes and gives the team the rest of the week to build a strategy around it instead of a spreadsheet.

    The 30, 60, 90 Day Check In

    Focus Digital’s churn data shows retainer clients lose about 8% of accounts in the first six months, with project-based clients losing nearly 28% in that same window. The first 90 days decide more relationships than any other stretch of the engagement. Running an audit at day 30, 60, and 90, rather than waiting for the quarterly business review, gives an account manager a natural reason to show measurable movement early, before doubt has time to set in.

    Proving Strategy, Not Just Execution

    The agencies most exposed to in-housing are the ones whose only visible output is content and a recap. Audits shift the conversation. Instead of “here is what we posted,” the conversation becomes “here is what the data says to do next, and here is why.” That distinction is exactly what separates a strategic partner from a vendor a client can eventually replace with a junior hire and a chatbot. Scaling strategy with AI only works if the AI output looks like strategy, not just automation.

    Waiting for the quarterly review to prove your value is like waiting for the tide to come in after the boat’s already left the dock.

    Delphi, Bluekona AI mascot

    Building an Audit-Led Service Layer With Bluekona

    Bluekona was built for exactly this workflow. It runs cross-platform audits across YouTube, Instagram, Facebook, and Threads, then turns the raw data into AI-generated insights an account manager can hand a client without translation. Instead of pulling metrics by hand or hiring a dedicated analyst, agencies use Bluekona to package proof of value into every pitch, every 30/60/90 day check in, and every renewal conversation.

    The AI-powered content repurposing layer matters here too. An audit that only diagnoses a problem leaves a client wondering what happens next. Bluekona pairs its findings with specific repurposing recommendations, so the “here’s what’s wrong” conversation always comes with a “here’s what we do about it” answer attached. That combination, diagnosis plus a concrete next step, is what turns an audit from a nice report into proof a retainer is worth renewing.

    For agencies juggling a dozen or more client accounts, the workspace model matters as much as the audit itself. Bluekona lets a team run every client’s cross-platform audit from a single dashboard, rather than logging into four different native analytics tools per client and stitching the numbers together in a spreadsheet. That structure is what makes the 30/60/90 day cadence realistic at scale. An account manager covering ten clients cannot manually rebuild a full audit for each one every month, but pulling an updated AI-generated audit from an existing workspace takes minutes, not a full afternoon per client.

    There is a hiring angle here too. As junior analyst and reporting roles compress across the industry in favor of AI-assisted workflows, agencies still need someone directing the strategy those audits point toward. Handing a strategist a clean, AI-generated audit instead of a pile of raw exports frees that person to spend their time on the part of the job a client is actually paying for, judgment.

    A Simple Framework for Rolling This Out This Quarter

    An agency does not need to rebuild its entire service model to start using audits as a retention tool. Four steps get most teams from pilot to habit inside a single quarter.

    TimelineActionFocus
    Weeks 1 to 2Run baseline audits across every active client’s core platformsFoundation
    Weeks 3 to 4Lead every new prospect call with a live audit instead of a template deckQuick win
    Month 2Build a standing 30, 60, and 90 day audit cadence into onboardingRetention
    Month 3Use quarter-over-quarter audit data as the backbone of renewalsScale

    Agencies are not losing clients because AI got better. They are losing clients because the gap between what agencies deliver and what clients now expect got wider, and audits are the fastest way to close it. The agencies still standing in 2027 will be the ones who used AI to prove strategic value quarter after quarter, not the ones who used it to draft a slightly faster status update.

    See what an AI-powered audit shows your next client

  • What Is The New Currency of Social Media?

    What Is The New Currency of Social Media?

    Something has shifted. You have probably felt it, even if you could not name it. A creator with 18,000 followers drops a video and the comment section explodes. A brand with two million followers posts something and it lands with a quiet thud. Crickets.

    People scroll faster than ever. Watch time is shrinking. Audiences consume content in bursts, fragments, and stolen moments. And yet, somehow, they are leaving more comments, saving more posts, sharing more things, and sliding into more DMs than ever before.

    This is not a contradiction. This is the new reality of social media.

    The platforms that are winning right now are not rewarding the people who get seen the most. They are rewarding the people who get responded to the most. The game has changed, and most brands are still playing by the old rules.

    Social media used to reward visibility. Now it rewards participation. And those are very different things.

    Why Follower Count Is Losing Its Meaning

    There was a time when follower count meant everything. It made sense. Feeds were chronological, so if you had a big audience, your posts reached them directly. You owned your audience the way a newspaper owned its subscribers. More followers meant more reach, full stop.

    That world is gone.

    Today, algorithms decide what gets seen. Not subscriber lists. Not follower counts. Algorithms look at engagement signals: how quickly people respond, how deep the conversations go, how often the same people keep coming back. A creator with 20,000 genuinely active followers can outperform one with two million passive ones because their content triggers real behavior.

    Follower count now tells you one thing: how many people once clicked a button. It does not tell you how many people trust the creator, remember their content, buy what they recommend, or care enough to come back. It is a headcount, not a relationship measure.

    20K Active followers can beat 2M passive ones in reach
    3x Engagement weight algorithms give comments over views
    80% Of buying decisions happen after social interaction, not just viewing

    The brands that have figured this out are not chasing follower counts anymore. They are chasing conversations. And there is a big, important difference between the two.

    Comments Are Becoming Their Own Culture

    Spend five minutes in a popular TikTok comment section and you will understand. The comments are not just reactions to the video. They are their own show. People are riffing off each other, building inside jokes, starting debates, doing bits. The original content becomes the stage and the comment section becomes the actual performance.

    This is not a quirk. This is a fundamental shift in how people use social platforms.

    On LinkedIn, a single provocative post can trigger a thread that runs for days. People who never watched the original video jump in because the debate is where the action is. On Instagram, meme replies and callback jokes in the comments get more engagement than the post itself. On YouTube, entire communities form inside the threads of certain channels, with regulars who know each other, reference past conversations, and build a shared culture that lives in the replies.

    Why do people love comments so much? Because they offer something that passive content never can: a way to be seen. When you drop a funny comment and people like it, you get a small but real moment of belonging. You signaled your humor, your worldview, your membership in the culture. That is deeply human. And it is now a core feature of how social media works.

    Comments are not just reactions anymore. They are entertainment layers, mini communities, algorithmic fuel, and increasingly, they are the reason people show up at all.

    Why View Time Is Falling but Engagement Is Rising

    Here is the part that confuses a lot of marketers. If people are scrolling faster and watching less, how is engagement going up? Should not the two move together?

    Not anymore.

    Modern users do not consume content the way they used to. They do not sit down and watch a 10-minute video from start to finish. They see a clip, catch the gist, jump to the comments, watch 40 seconds, get pulled into a thread, share a screenshot to a friend, come back three hours later to check replies. Their attention is fragmented, but their participation is real and it is active.

    Attention is not disappearing.
    It is fragmenting.

    What this means practically is that average view duration is a weaker signal than it used to be. Someone who watches 12 seconds of your video, laughs, and sends it to four people is more valuable than someone who watches the whole thing and scrolls past. The first person participated. The second one consumed.

    Platforms have figured this out. The algorithm is no longer just looking at watch time. It is looking at what happens around the content. Did people react? Did they comment? Did they save it? Did they come back? Did the same people engage twice? These signals carry more weight than raw view counts, and they are reshaping what it means to have good content.

    Social Media Is Becoming Participation Media

    Let us name what is actually happening here. Social media is not really social media anymore in the old sense. It is not a broadcasting platform where creators publish and audiences watch. It is a participation platform where the content is just the opening move in a much bigger conversation.

    Old Social Media
    • Broadcasting content outward
    • Creator-centric model
    • Passive audiences watching
    • Follower count = power
    • Views are the win
    • One-way communication
    New Social Media
    • Conversations and participation
    • Community-centric model
    • Active audiences responding
    • Engagement depth = power
    • Recurring interaction is the win
    • Two-way and multi-way dialogue

    The features that platforms are building tell the whole story. Stitches, duets, reaction videos, collaborative posts, comment-pinning, reply threads, DM links from posts: all of these are participation tools, not broadcasting tools. They are built to pull the audience into the content, not just in front of it.

    The brands winning on social right now treat every post as an invitation. An invitation to respond, to share an opinion, to join a joke, to start something. Not a billboard. An opening line.

    The Rise of Engineered Engagement

    Here is where things get interesting, and a little bit clever. Creators and marketers have started to realize that participation can be designed. You do not have to wait and hope people comment. You can build systems that make it almost inevitable.

    You have probably seen this everywhere by now. “Comment GUIDE below and I’ll DM you the full resource.” “Type TEMPLATE and I’ll send it straight to your inbox.” “Reply PART 2 if you want me to continue this.” These are not accidents. They are engineered participation loops, and they work.

    A comment today is often more valuable than a passive view. It signals intent, emotional response, participation, and algorithmic relevance, all at once.

    Tools like ManyChat have made this systematic. Someone comments a keyword, an automated DM fires, a funnel begins. The comment triggers distribution. The comment triggers lead generation. The comment triggers a conversation that might end in a sale. One action, multiple outcomes.

    This is not manipulation. It is smart design. It meets people where they already are, in the comment section, doing what they already want to do, and it turns that behavior into something useful. For the creator and for the audience.

    The Problem With Modern Engagement Loops

    But here is the honest part. Not everything about engineered engagement is good.

    When every creator is doing “comment PART 2,” the comment section starts to feel like a vending machine. Transactional. Hollow. People comment the keyword because they want the thing, not because they actually care. The conversation looks real on the surface, but there is no genuine exchange happening underneath.

    Fake urgency has become a plague. “Last 24 hours to get this.” “Only 3 spots left.” “You need to see this before it’s gone.” When everyone uses the same tricks, the tricks stop working. And worse, they start to erode trust.

    The brands that are going to win long-term are not the most automated. They are the ones that combine scalable systems with genuine interaction. They use the tools to handle volume, but they show up personally when it matters. They respond to comments like humans, not robots. They build systems that serve real relationships, not systems that simulate them.

    Automation is a multiplier. But you have to start with something worth multiplying.

    What Brands Are Still Measuring Wrong

    Most brand social media reports still look the same. Impressions this month. Follower growth. Reach. Views. Maybe engagement rate as a percentage.

    These numbers feel safe because they are easy to explain. “We reached 400,000 people this month.” Great. But did any of them care? Did any of them come back? Did a single one of them feel like they were part of something?

    The old metrics were built for broadcasting. Count how many people you reached. The new metrics need to be built for participation. Measure how many people responded, returned, and brought their friends.

    Reach without participation has limited value. You can pay for reach. You can buy impressions. What you cannot buy is a community of people who genuinely give a damn about what you do.

    The New Metrics That Actually Matter

    So what should you be measuring instead? Here are the signals that tell you whether your social presence is actually building something.

    💬 Comment depth Conversation quality
    🔁 Repeat commenters Returning voices
    🔖 Save behavior Intentional interest
    💌 DM conversions Relationship signals
    📈 Engagement velocity How fast response grows
    🎯 Sentiment quality What people feel

    Repeat commenters tell you that someone is coming back because they want to be part of what you are building, not just because an algorithm served your post. Save behavior tells you that someone valued your content enough to want it again later. DM conversions tell you that a public interaction turned into a private relationship, which is where trust really lives.

    Engagement velocity tells you whether your content is sparking something that compounds. A post that gets 50 comments in an hour and then builds to 300 over three days is a very different beast from a post that gets 300 comments once and goes silent. The first one has momentum. The second one is just a spike.

    These are participation signals. And they are the most honest picture of whether your social presence is actually working.

    Where Bluekona Fits Into All of This

    This is exactly the problem Bluekona was built to solve. Not just what gets seen, but what actually creates participation and builds community momentum over time.

    Detects meaningful engagement patterns

    Identifies what sparks real discussion, what creates recurring interaction, and what your audience emotionally responds to.

    Tracks participation beyond vanity metrics

    Measures comment behavior, engagement depth, audience return patterns, and participation consistency over time.

    Finds your compounding content

    Shows which themes build communities, which formats sustain interaction, and what creates recall instead of a one-time spike.

    Answers the questions that matter

    Not just “how many views did this get?” but did people care, did they participate, did conversations continue, did the community strengthen?

    Why Viral Reach Is Becoming Less Valuable

    Here is a slightly uncomfortable truth that the industry does not talk about enough. Going viral is not what it used to be. Ten years ago, viral meant something. It meant your content broke through, that millions of people chose to share it, that you had captured something real about a cultural moment.

    Today, viral can mean an algorithm pushed your content to a cold audience who scrolled past it in 2 seconds, boosted by a spike of passive eyeballs that evaporated the next morning and left nothing behind. No new followers. No conversation. No community. No recall.

    Visibility without participation is increasingly hollow. You can have a post that reaches 5 million people and builds less lasting value than one that reaches 50,000 people who feel genuinely connected to what you do.

    The brands that understand this are shifting their goal. Not just: reach as many people as possible. But: reach the right people, and give them a reason to respond, return, and recruit others. That is a compounding strategy. That is how communities actually form.

    What This Means for You Right Now

    If you take one thing from all of this, let it be this: the social media game has moved. The old scorecard is broken. Follower counts, raw views, and passive impressions are not the full story anymore, and optimizing for them alone is increasingly a path to spinning your wheels without going anywhere.

    The new game is participation. It is about creating content that people feel compelled to respond to. It is about building systems that turn responses into relationships. It is about measuring the things that actually compound over time, repeat visitors, deep conversations, saves, DMs, community momentum.

    This does not mean you stop caring about reach. Reach still matters. But reach is the starting point, not the finish line. What you do with that reach, how you turn passive eyeballs into active participants, that is where the real value is built.

    The brands that figure this out now will have an enormous head start. Because right now, most of their competitors are still chasing the old numbers. And while they are busy counting followers, the smart brands are building communities that will still be showing up three years from now.

    Stop measuring only visibility

    Understand what actually drives participation. Build communities, not vanity metrics. Measure what compounds.

  • How Snack Founders Can Turn One Chip Bag into 10,000 Views

    How Snack Founders Can Turn One Chip Bag into 10,000 Views

    The snack aisle is now digital. Your next customer probably saw your chips on TikTok before they ever spotted them on a grocery shelf. They craved your popcorn because an influencer made it look irresistible. They bought your protein bars because a Reel made them hungry at 11 PM.

    Here’s what’s wild: 93% of Americans regularly see food content on social media, and food-related posts make up nearly 40% of their feeds. That’s not background noise—that’s your battleground.

    Yet most snack solopreneurs are posting blind. They’re churning out content without knowing which posts actually drive cravings, clicks, or conversions. They’re guessing at strategy when they should be analyzing data.

    Without a social media audit, your content strategy is just expensive guesswork. And in an industry where 34% of U.S. consumers discover new snacks via social media—and 40% literally snack while scrolling—you can’t afford to guess.

    The big brands get it. Doritos has over 1 million Instagram hashtags. Oreo dominates with 9.7 million. Kit Kat sits pretty at 3.7 million. That’s not luck or legacy—it’s consistent, data-informed branding. And you can do it too.

    What a Social Media Audit Actually Does (and Why It Matters)

    Think of a social media audit as your marketing taste test. It’s a structured review that helps you understand your flavor of content performance—what’s working, what’s stale, and what deserves to be your signature recipe.

    For snack solopreneurs, an audit means knowing:

    • Which flavors, packaging shots, or product angles resonate most
    • Which videos or posts drive engagement spikes (and which ones fall flat)
    • Where your audience scrolls, comments, saves, and actually buys
    • How you stack up against competitors in the same category

    The purpose? To measure your brand awareness, audience demographics, and ROI across every platform—so you can turn scattered likes into a clear growth recipe.

    A social media audit helps snack founders stop throwing content at the wall and start building a system that feeds sustainable growth.

    How to Conduct a Social Media Audit (Step-by-Step for Snack Brands)

    Ready to get tactical? Here’s how to run an audit that’s quick, strategic, and realistic—no agency required.

    Step 1: Inventory Your Social Channels

    Start with a complete list of every account: TikTok, Instagram, YouTube, Facebook, even that Twitter account you started and abandoned in 2021. If it has your brand name on it, it matters. Dormant profiles can confuse customers and hurt your credibility.

    Step 2: Gather Post Performance Data

    Pull metrics on engagement rate, link clicks, saves, comments, and shares. Look at the last 90 days minimum—ideally six months if you’re seasonal (think summer snacks vs. holiday gift sets).

    Pro tip for snack brands: Categorize your content by theme. Analyze “flavor content” (spicy launches, sweet collabs, limited editions) versus evergreen posts (brand story, behind-the-scenes, product benefits). Which type actually moves the needle?

    Step 3: Identify Audience Insights

    Who’s actually engaging with your content? Dig into age, region, interests, and behaviors. Are you reaching protein-obsessed gym-goers? Late-night snackers? Parents looking for lunchbox options? Your product positioning should match who’s showing up, not who you hope shows up.

    Remember: 55% of Millennials and Gen Z consider themselves savvy snackers, with 32% turning to social media for snack inspiration. If you’re not showing up in their feeds with the right message, someone else is.

    Step 4: Compare Your Top-Performing Posts

    Which posts went viral, and why? Was it humor? Crunch sound ASMR? A trending audio? An influencer collaboration? Look for patterns across your winners.

    For younger generations, social media (73%), video content (71%), and food influencers (61%) are the primary ways they discover new snacks. If your top posts don’t leverage at least one of these formats, you’re leaving engagement on the table.

    Step 5: Run Competitor Checks

    Benchmark yourself against similar snack startups and established players like Lay’s, Pringles, Doritos, or Hershey’s (which generates over 1 million hashtags). What are they doing that you’re not? Where are they falling short that you could capitalize on?

    Look at their posting frequency, content mix, engagement rates, and how they’re riding trends. Are they leaning into health claims? Adventurous flavors? User-generated content? Steal what works, skip what doesn’t.

    Step 6: Identify Strengths, Weaknesses, Opportunities, and Threats

    Run a SWOT analysis on your social presence:

    • Strengths: What content formats consistently perform? Where do you overdeliver compared to competitors?
    • Weaknesses: Which platforms are you ignoring? What content types underperform?
    • Opportunities: Emerging trends you haven’t tapped (61% of Americans are open to trying sweet and smoky snacks—are you talking about this?)
    • Threats: Where are competitors dominating conversations you should own?

    Don’t forget the macro trends. “Better-for-you” snacks are driving 64.1% of consumer interest in 2025, with 55% pointing to protein as the most important health claim. If your audit shows you’re not addressing these demands, that’s a massive opportunity gap.

    Step 7: Build Your Audit Report

    Don’t let your findings die in a Google Doc. Summarize key takeaways and translate them into action: next month’s content themes, optimal posting times, platform priorities, and budget allocation.

    Better yet, skip the three-hour spreadsheet session entirely. bluekonaAI automates every step—tracking performance across TikTok, Instagram, and YouTube so you know exactly what’s working without manual data pulls, formula errors, or decision paralysis.

    What to Include in a Snack Brand’s Social Media Audit Report

    Your audit report should be lean but comprehensive. Focus on insights that change your strategy, not vanity metrics that stroke your ego. Include:

    Post Performance Metrics: Engagement rate, reach, saves, shares, and link clicks. Which posts actually drive action?

    Content Mix Analysis: Break down performance by content type—product shots, user-generated content, taste tests, recipe ideas, behind-the-scenes, trends. What ratio works best for your brand?

    Platform Breakdown: Understand what each platform does for you. TikTok drives trends and viral moments. Instagram showcases beautiful, “Instagrammable” visuals. YouTube hosts longer-form recipe content and reviews. Facebook connects with an older demographic looking for product info.

    Audience Insights: Demographics, active times, interests, and behaviors. Are you reaching the right people at the right moments?

    Top Influencers and Advocates: Who’s already tagging or mentioning your brand organically? These are your low-hanging fruit for partnerships and amplification.

    Growth Opportunities: Channels, content types, or topics you’re underutilizing. Maybe your ASMR crunch videos crush it, but you’ve only posted three. That’s actionable intel.

    From Data to Decisions: Turning Audits into Sales

    Here’s the truth: engagement is nice, but it doesn’t pay rent. Your audit should translate directly into demand and revenue.

    Identify viral potential. Which videos make people hungry enough to click “buy now”? A TikTok-fueled cottage cheese trend drove a 166% increase in Gopuff orders in 2024. That’s the power of turning social buzz into sales momentum.

    Use AI audit data to optimize everything. Align your posting frequency, timing, creative direction, and ad targeting based on what actually performs—not what you think should work.

    Discover which trends to jump on. The data shows consumers are increasingly adventurous (61% open to sweet and smoky combos) and health-conscious (64.1% seeking “better-for-you” options). If your audit reveals you’re not addressing these desires, pivot immediately.

    Understand the impulse purchase pathway. Over one-third (34%) of U.S. consumers discover new snacks via social media, and platforms with integrated shopping links facilitate impulse buys. Are you making it easy for people to go from craving to cart?

    Leverage emotional triggers. Research shows that viewing appetizing food images on social media activates the brain’s reward centers, increasing cravings and the likelihood of impulsive eating—especially for high-calorie items. Your content isn’t just informative; it’s neurological marketing.

    bluekonaAI’s automated social media audit helps solopreneurs move from post-and-pray to plan-and-grow. You get real-time insights, performance benchmarks, and content recommendations—without the manual labor.

    Skip the Template Trap

    Most “free social media audit templates” are just fancy to-do lists that eat up hours of your time. You download a spreadsheet, manually input data from five different platforms, create pivot tables, and by the time you’re done analyzing last month, you’ve already posted another 30 pieces of content you haven’t measured.

    That’s not efficiency. That’s busywork disguised as strategy.

    Instead of giving you a static template that makes you the data entry person, bluekonaAI runs your audit instantly. It auto-fills with live data, tracks changes over time, and highlights what actually matters—so you can spend your energy on creating crave-worthy content, not wrestling with Excel formulas.

    People Don’t Just Snack While Scrolling—They Scroll to Snack

    Let that sink in. 40% of Americans snack while scrolling social media, and nearly half (48.8%) consume three or more snacks daily. Your audience isn’t passively encountering your content—they’re actively hunting for their next flavor obsession.

    Social media isn’t just where people discover snacks. It’s where cravings start, trends explode, and purchase decisions happen in real time.

    If you’re a snack solopreneur competing against brands with million-dollar marketing budgets, you can’t outspend them. But you can outsmart them. A regular, data-driven social media audit gives you clarity on what’s working, what’s wasted effort, and where your biggest growth opportunities hide.

    You don’t need an agency. You don’t need a marketing degree. You need the right tool and the willingness to let data guide your decisions.

    Don’t Let Your Best Content Go Stale

    Every post you publish is either bringing customers closer or letting them slip away. The difference between growth and stagnation isn’t more content—it’s smarter content.

    bluekonaAI helps snack solopreneurs run faster, smarter social media audits that are free, automated, and built for growth. Stop guessing which posts work. Start knowing.

    Your next viral moment is hiding in your data. Let’s find it.

    Run Your Free Audit with bluekonaAI

    Stop posting blind. Start growing smart. With bluekonaAI, your social media audit is done before you even think about it—giving you more time to build the snack brand your audience is craving.

  • How Beverage Brands Can Run a Smart Social Media Audit

    How Beverage Brands Can Run a Smart Social Media Audit

    Your social posts are your storefront. Every TikTok video, Instagram Reel, and Facebook carousel is a first impression—a chance to turn scrollers into sippers. But here’s the uncomfortable truth: if you’re posting seven times a week and can’t name your top-performing post, you don’t need new ideas. You need a better audit.

    Most beverage brands are stuck in a posting hamster wheel—churning out content without measuring what actually moves the needle. Meanwhile, 90% of consumers use social media to discover new products

    . The opportunity is massive. The gap between effort and outcome? Even bigger.

    The food and beverage industry now spends $3.5 billion on social media advertising annually, making it the second most popular digital strategy in the space. Beverage brands post an average of 7.9 times per week, generating 1.17K engagements per post—but the average engagement rate sits at just 0.02%. That’s a lot of noise for very little signal.

    A social media audit cuts through that noise. It’s your roadmap to better visibility, consistent engagement, and ROI clarity. And with the right approach, you don’t need an agency or a stack of spreadsheets to make it happen.

    What a Social Media Audit Actually Is (and Why It Matters for Beverage Brands)

    A social media audit is a structured review of your brand’s online presence. It tracks post performance, audience demographics, content ROI, and platform health—all to help you understand where you’re growing, stagnating, or missing opportunities.

    For beverage marketers, this means understanding which flavors, visuals, collaborations, or campaigns actually convert. It’s about connecting every post to your business objectives—whether that’s brand awareness, product launches, or direct sales.

    An audit gives you the big picture—not just who’s watching, but why they engage. It turns gut feelings into data-backed decisions and helps you stop wasting time on content that doesn’t perform.

    How to Conduct a Social Media Audit (Step-by-Step)

    Ready to dig in? Here’s how to run a beverage-specific audit that delivers actionable insights—not just vanity metrics.

    Step 1: List All Your Active and Inactive Channels

    Start with a complete inventory. Facebook, Instagram, TikTok, YouTube, LinkedIn—even that old Twitter account you forgot about. If it carries your brand name, it matters. Abandoned or inconsistent profiles can confuse customers and dilute your brand presence.

    Step 2: Gather Content and Post Performance Data

    Pull data on impressions, engagement rate, link clicks, post type, and posting frequency. Look at the last 90 days minimum—ideally six months for seasonal beverage brands. Track which content formats (Reels, carousels, Stories) perform best on each platform.

    Step 3: Analyze Audience Demographics

    Who’s actually engaging with your content? Dive into age, gender, geography, and device usage. This is especially critical for beverage brands—your kombucha audience on Instagram might skew younger and coastal, while your craft beer followers on Facebook could be older and regional. Match your content strategy to who’s actually showing up.

    Step 4: Compare Your Top-Performing Posts

    Identify patterns across your best content. Use content tags like recipes, behind-the-scenes, product launches, influencer collaborations, or user-generated content. Which formats consistently drive engagement? Which storytelling angles resonate most? This is where you discover what your audience actually wants—not what you think they want.

    Step 5: Review ROI and Conversions

    Vanity metrics don’t pay the bills. Which platforms actually generate clicks, inquiries, or orders? Track link clicks, website traffic from social, and conversion paths. If your TikTok has massive reach but zero conversions while your Instagram Stories quietly drive sales, that’s critical intel for budget allocation.

    Step 6: Identify Strengths, Weaknesses, Opportunities, and Threats

    Map your SWOT visually. What’s overperforming? What’s being ignored? Where are your competitors showing up that you’re not? Look for content gaps, underutilized platforms, and emerging trends in your category. Maybe your behind-the-scenes brewery content crushes on Instagram but you’ve never tried it on TikTok. That’s an opportunity.

    Step 7: Turn It Into a Report

    Don’t let your audit live in scattered notes. Use a structured template or—better yet—an AI-powered dashboard like bluekona to track results over time. bluekona automates every audit step, turning your weekly social data into a clear, visual report you can act on instantly. No manual exports, no formula errors, no three-hour spreadsheet sessions.

    What to Include in a Beverage Brand Audit Report

    Your audit report should be comprehensive but scannable. Focus on insights that drive decisions, not data dumps. Include:

    Audience Demographics: Who engages most with your content? Break down by age, location, and platform preferences.

    Platform Performance Comparison: How does Facebook stack up against Instagram, TikTok, and YouTube? Where should you double down, and where should you pull back?

    Content Categories: Analyze performance by content type—recipes, influencer features, promotions, sustainability stories, product launches. What themes consistently outperform?

    Influencer and Employee Advocacy ROI: If you’re working with influencers or activating employee advocates, measure their impact. Are micro-influencers driving better engagement than celebrity partnerships? Is your team’s content more authentic than branded posts?

    Content Frequency vs. Engagement Correlation: Are you posting too much or too little? Sometimes less is more—especially if quality dips with volume.

    Weaknesses and Opportunities Analysis: Be brutally honest about what’s not working. Inconsistent branding? Weak hashtag strategy? Ignoring video when your audience craves it? Name it.

    Key Recommendations for the Next Cycle: Turn insights into action items with clear ownership and deadlines.

    From Reporting to Action: Turning Audits Into Strategy

    An audit is only valuable if it changes what you do next. Here’s how to turn insights into action:

    Refine your posting schedule and creative direction based on when and what your audience engages with most. If carousel posts about cocktail recipes perform best on Wednesday evenings, build around that pattern.

    Identify which post types or campaigns deserve repurposing. That viral Reel about your new flavor? Turn it into a YouTube Short, an Instagram Story highlight, and a website banner. Maximize every win.

    Let AI highlight gaps you might miss manually—like inconsistent branding across platforms, weak hashtag performance, or dormant audience segments you could re-engage.

    Create monthly action plans instead of one-off reports. Make auditing a continuous process, not a quarterly chore. bluekona links your audit data directly to your content repurposing and scheduling workflows—so you can fix and scale in one go.

    The beverage industry moves fast. Trends shift, platforms evolve, and consumer tastes change. Regular audits keep your strategy nimble and your content relevant.

    Audit Less. Learn More.

    Manual audits are exhausting. Spreadsheets break. Data gets outdated the moment you export it. And most importantly, you didn’t get into beverage marketing to become a data analyst.

    That’s where AI-powered tools like bluekona change the game. Instead of spending hours compiling reports, you get dynamic benchmarking, automated performance tracking, and content optimization recommendations—all in one platform. bluekona turns your beverage brand’s data into a clear action plan, so every post works harder.

    Social media marketing isn’t about posting more—it’s about posting smarter. An audit gives you the clarity to stop guessing and start growing.

    Ready to see what your data is actually telling you?