Tag: analytics

  • How to Report Social Media Results to Leadership Without Losing the Room

    How to Report Social Media Results to Leadership Without Losing the Room

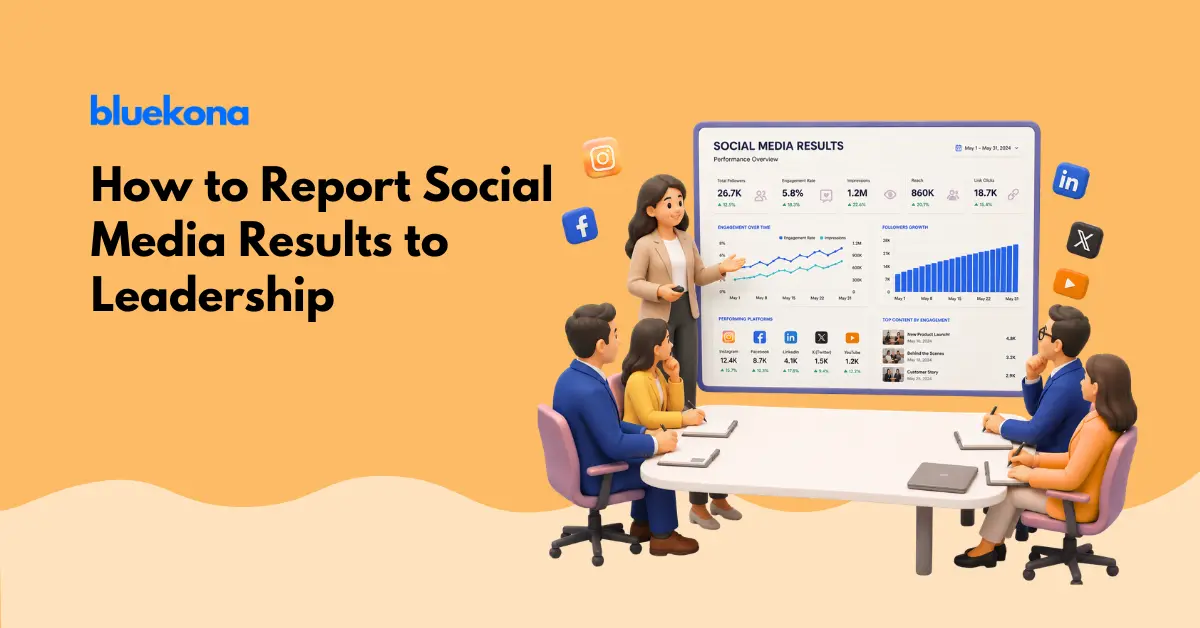
    You spend an hour every month pulling numbers into a slide deck. Reach is up. Engagement is up. Followers are up. Then you present it to your founder or your leadership team, and the room goes quiet in the wrong way. Nobody argues with the numbers. Nobody looks convinced by them either.

    That gap is one of the most common frustrations in marketing right now. 65% of leadership want to see direct connections between social campaigns and business goals, and 52% want quantifiable cost savings across their channels. Your report might be perfectly accurate. It might just be answering questions nobody in that room is actually asking.

    This guide walks through how to build a social media report leadership actually trusts, one that speaks in business outcomes instead of platform metrics, and how tools like Bluekona’s AI powered audits can do most of that translation work for you automatically.

    65%
    of leadership want social campaigns tied directly to business goals
    Verloop, August 2025
    30%
    of marketers believe they can actually measure social media ROI
    Statista, May 2025
    21%
    rise in board pressure on marketing leaders to prove ROI since 2023
    The CMO Survey, Spring 2025

    Why Your Leadership Report Keeps Falling Flat

    Most social media reports fail for a simple reason. They are written by a marketer, for a marketer. Every number on the page makes sense to the person who built the dashboard. Almost none of it maps cleanly onto the questions a founder or a CFO is actually holding in their head walking into that meeting.

    The metrics you track aren’t the metrics they care about

    Reach, impressions, and engagement rate are genuinely useful. They tell you whether your content strategy is working from one week to the next. They tell your leadership almost nothing about whether the marketing budget is paying for itself. When a report opens with platform level metrics, it is speaking a language leadership never agreed to learn. Our piece on the problem with social media metrics goes deeper into why this disconnect exists in the first place, and it is worth reading before you build your next report.

    The attribution gap everyone feels but nobody names

    Nearly every executive believes social media influences revenue somewhere along the funnel. Very few of them can point to the exact number. 97% of leaders believe they can communicate social media’s value internally, yet only 30% of marketers believe they can actually measure social ROI, according to a Statista survey. That gap between belief and proof is the whole problem. Believing something matters is not the same as proving it, and leadership knows the difference even when they cannot articulate it.

    Delphi, Bluekona AI mascot

    Everybody believes social media works. That’s cute. Show me the number or it did not happen.

    What Leadership Actually Wants to Hear

    Leadership is not asking you to abandon social media metrics. They are asking you to translate them. A founder does not need to know your share to reach ratio. They need to know whether the marketing team is moving the business forward, and by roughly how much.

    Business outcomes over vanity metrics

    Followers, likes, and impressions are participation numbers. They describe activity, not impact. Business outcomes such as qualified leads generated, website traffic from social, revenue assisted by social touchpoints, and customers retained through social support are the numbers that connect your work to what leadership actually manages toward. Pressure to make that connection keeps climbing. The CMO Survey found that board level pressure on marketing leaders to prove ROI rose 21% between 2023 and 2025, with pressure from the CFO alone climbing 52% in the same period.

    The three questions every executive is silently asking

    Every leadership report should answer three questions, whether or not leadership says them out loud. Is this working, translated into numbers a P&L would recognize. Is this worth what we are spending on it, compared to other channels. What happens to the business if this budget got cut in half next quarter. If your report cannot answer those three questions on the first page, everything else you present is just supporting detail nobody asked for.

    The Report Structure That Actually Lands

    The single biggest change you can make to a leadership report has nothing to do with which metrics you include. It is the order you present them in.

    Lead with the business question, not the platform breakdown

    Open with the outcome, then support it with the platform data, not the reverse. Start the report with a single sentence such as “social media contributed to 40 qualified leads and an estimated portion of pipeline this quarter,” then use the rest of the page to show your work. Most reports do this backwards, opening with an Instagram summary, then a Facebook summary, then a LinkedIn summary, and only mentioning business impact on the last slide if there is time left. Leadership checks out long before that slide arrives.

    One page, three numbers, one story

    Discipline is the differentiator here. Pick three numbers that matter most this period, not fifteen. Wrap them in a single narrative about what changed and why. A report with three well chosen numbers and a clear story beats a report with thirty numbers and no throughline, every single time.

    The One Page Rule

    If your leadership report cannot fit on one page with room to breathe, you have not finished editing it yet. Cut until the story is obvious, then stop.

    One page. Three numbers. One story. If your report needs its own table of contents, you already lost the room.

    Delphi, Bluekona AI mascot

    Where Bluekona does the translation work for you

    Pulling this structure together manually every month means logging into four different platform dashboards, exporting spreadsheets, and reconciling numbers that were never designed to sit next to each other. This is exactly the gap Bluekona was built to close. A cross-platform social media audit from Bluekona pulls your YouTube, Instagram, Facebook, and Threads data into one place and applies AI generated insights that already speak in outcomes rather than raw platform metrics. Instead of spending an afternoon reconciling numbers, you get a business ready summary you can drop straight into your leadership report, along with the supporting detail if anyone asks for it. You can also see how our guide on scaling social media strategy with AI connects to this same idea of letting automation carry the reporting workload.

    Turning Raw Metrics Into an Executive Narrative

    Once you have your three numbers, the next skill is translation. This is where most reports either win the room or lose it entirely.

    From engagement rate to pipeline signal

    Engagement rate on its own means little to leadership. Reframed as a pipeline signal, it becomes useful. Instead of reporting “engagement rate was 4.2% this month,” report “content that answered a specific customer question generated three times the saves and drove a measurable increase in demo requests.” The number is the same underlying data. The story is what makes it land. Our post on the link between content and conversion breaks down how to make that connection credibly instead of stretching the data further than it can go.

    From reach to brand equity, in plain language

    Reach and impressions are not worthless, they are just misunderstood at the leadership level. Reframe them as brand equity building, the slow accumulation of familiarity and trust that eventually shortens your sales cycle. Say it plainly. “Our reach growth this quarter means more of our target buyers recognize the brand before a sales conversation ever starts.” That sentence does more work in a leadership meeting than any reach chart ever will.

    A Sample Monthly Leadership Report Template

    Here is a simple structure you can adapt starting with your next reporting cycle. It leads with outcomes, keeps supporting metrics visible, and flags status clearly so leadership can scan it in under a minute.

    MetricWhat It Tells LeadershipStatus
    Social assisted revenueDirect dollar contribution from social touchpointsOn Track
    Qualified leads from socialVolume feeding directly into the sales pipelineWatch
    Cost per social acquired customerEfficiency compared to paid alternativesOn Track
    Branded search volumeLong term brand equity buildingAt Risk

    What to include, what to cut

    Include anything that ties back to revenue, pipeline, retention, or brand equity. Cut anything that only measures activity, such as number of posts published or hours spent on content creation. Those numbers matter to you as a manager. They mean nothing to someone deciding whether to fund next quarter’s budget.

    Common Mistakes That Undermine Your Credibility

    A few habits quietly damage trust in your reporting over time, even when the underlying work is strong.

    Strong Report
    • Opens with one clear business outcome
    • Three metrics maximum on the summary page
    • Plain language, no platform jargon
    • Flags risk areas honestly, before leadership asks
    Weak Report
    • Opens with a platform by platform breakdown
    • Fifteen or more metrics with no clear priority
    • Heavy jargon assumed to be self explanatory
    • Only positive numbers shown, risk buried or skipped

    Overloading the room with data

    More data does not build more trust. It usually does the opposite. When leadership sees twenty charts, they assume you are hiding the real story behind volume. A tight report signals confidence. A dense one signals uncertainty, even when the underlying numbers are good.

    Reporting activity instead of outcomes

    Number of posts, number of stories, number of hours spent editing video, these describe effort, not results. Leadership funds results. If your report leans heavily on activity metrics, it reads as an excuse for a missing outcome rather than evidence of one.

    Building a Reporting Cadence Leadership Trusts Over Time

    One good report earns attention. A consistent cadence earns trust. Report on the same three to five outcome metrics every single cycle so leadership can see trendlines, not just snapshots. Flag risk honestly and early, since leadership forgives a missed number far more easily than a surprised one. And keep the format identical every time. Predictability is part of what makes a report feel credible, because leadership starts to recognize the pattern and trust what sits inside it.

    None of this requires a new dashboard built from scratch or a data analyst on staff. It requires a consistent source of truth across every platform you run, translated into language that matches how your leadership actually thinks about the business.

    Delphi, Bluekona AI mascot

    Let Bluekona chew through the platform data so you walk into that meeting looking like the smartest person in it. I will take the credit later.

    If you are rebuilding your reporting process this quarter, start with a single cross platform audit. Seeing your YouTube, Instagram, Facebook, and Threads performance translated into one business ready summary is usually the fastest way to spot which three numbers deserve the spotlight in your very next leadership meeting. Our guide to tracking content performance without a spreadsheet pairs well with this process if you want to go deeper on the mechanics.
  • What Is The New Currency of Social Media?

    What Is The New Currency of Social Media?

    Something has shifted. You have probably felt it, even if you could not name it. A creator with 18,000 followers drops a video and the comment section explodes. A brand with two million followers posts something and it lands with a quiet thud. Crickets.

    People scroll faster than ever. Watch time is shrinking. Audiences consume content in bursts, fragments, and stolen moments. And yet, somehow, they are leaving more comments, saving more posts, sharing more things, and sliding into more DMs than ever before.

    This is not a contradiction. This is the new reality of social media.

    The platforms that are winning right now are not rewarding the people who get seen the most. They are rewarding the people who get responded to the most. The game has changed, and most brands are still playing by the old rules.

    Social media used to reward visibility. Now it rewards participation. And those are very different things.

    Why Follower Count Is Losing Its Meaning

    There was a time when follower count meant everything. It made sense. Feeds were chronological, so if you had a big audience, your posts reached them directly. You owned your audience the way a newspaper owned its subscribers. More followers meant more reach, full stop.

    That world is gone.

    Today, algorithms decide what gets seen. Not subscriber lists. Not follower counts. Algorithms look at engagement signals: how quickly people respond, how deep the conversations go, how often the same people keep coming back. A creator with 20,000 genuinely active followers can outperform one with two million passive ones because their content triggers real behavior.

    Follower count now tells you one thing: how many people once clicked a button. It does not tell you how many people trust the creator, remember their content, buy what they recommend, or care enough to come back. It is a headcount, not a relationship measure.

    20K Active followers can beat 2M passive ones in reach
    3x Engagement weight algorithms give comments over views
    80% Of buying decisions happen after social interaction, not just viewing

    The brands that have figured this out are not chasing follower counts anymore. They are chasing conversations. And there is a big, important difference between the two.

    Comments Are Becoming Their Own Culture

    Spend five minutes in a popular TikTok comment section and you will understand. The comments are not just reactions to the video. They are their own show. People are riffing off each other, building inside jokes, starting debates, doing bits. The original content becomes the stage and the comment section becomes the actual performance.

    This is not a quirk. This is a fundamental shift in how people use social platforms.

    On LinkedIn, a single provocative post can trigger a thread that runs for days. People who never watched the original video jump in because the debate is where the action is. On Instagram, meme replies and callback jokes in the comments get more engagement than the post itself. On YouTube, entire communities form inside the threads of certain channels, with regulars who know each other, reference past conversations, and build a shared culture that lives in the replies.

    Why do people love comments so much? Because they offer something that passive content never can: a way to be seen. When you drop a funny comment and people like it, you get a small but real moment of belonging. You signaled your humor, your worldview, your membership in the culture. That is deeply human. And it is now a core feature of how social media works.

    Comments are not just reactions anymore. They are entertainment layers, mini communities, algorithmic fuel, and increasingly, they are the reason people show up at all.

    Why View Time Is Falling but Engagement Is Rising

    Here is the part that confuses a lot of marketers. If people are scrolling faster and watching less, how is engagement going up? Should not the two move together?

    Not anymore.

    Modern users do not consume content the way they used to. They do not sit down and watch a 10-minute video from start to finish. They see a clip, catch the gist, jump to the comments, watch 40 seconds, get pulled into a thread, share a screenshot to a friend, come back three hours later to check replies. Their attention is fragmented, but their participation is real and it is active.

    Attention is not disappearing.
    It is fragmenting.

    What this means practically is that average view duration is a weaker signal than it used to be. Someone who watches 12 seconds of your video, laughs, and sends it to four people is more valuable than someone who watches the whole thing and scrolls past. The first person participated. The second one consumed.

    Platforms have figured this out. The algorithm is no longer just looking at watch time. It is looking at what happens around the content. Did people react? Did they comment? Did they save it? Did they come back? Did the same people engage twice? These signals carry more weight than raw view counts, and they are reshaping what it means to have good content.

    Social Media Is Becoming Participation Media

    Let us name what is actually happening here. Social media is not really social media anymore in the old sense. It is not a broadcasting platform where creators publish and audiences watch. It is a participation platform where the content is just the opening move in a much bigger conversation.

    Old Social Media
    • Broadcasting content outward
    • Creator-centric model
    • Passive audiences watching
    • Follower count = power
    • Views are the win
    • One-way communication
    New Social Media
    • Conversations and participation
    • Community-centric model
    • Active audiences responding
    • Engagement depth = power
    • Recurring interaction is the win
    • Two-way and multi-way dialogue

    The features that platforms are building tell the whole story. Stitches, duets, reaction videos, collaborative posts, comment-pinning, reply threads, DM links from posts: all of these are participation tools, not broadcasting tools. They are built to pull the audience into the content, not just in front of it.

    The brands winning on social right now treat every post as an invitation. An invitation to respond, to share an opinion, to join a joke, to start something. Not a billboard. An opening line.

    The Rise of Engineered Engagement

    Here is where things get interesting, and a little bit clever. Creators and marketers have started to realize that participation can be designed. You do not have to wait and hope people comment. You can build systems that make it almost inevitable.

    You have probably seen this everywhere by now. “Comment GUIDE below and I’ll DM you the full resource.” “Type TEMPLATE and I’ll send it straight to your inbox.” “Reply PART 2 if you want me to continue this.” These are not accidents. They are engineered participation loops, and they work.

    A comment today is often more valuable than a passive view. It signals intent, emotional response, participation, and algorithmic relevance, all at once.

    Tools like ManyChat have made this systematic. Someone comments a keyword, an automated DM fires, a funnel begins. The comment triggers distribution. The comment triggers lead generation. The comment triggers a conversation that might end in a sale. One action, multiple outcomes.

    This is not manipulation. It is smart design. It meets people where they already are, in the comment section, doing what they already want to do, and it turns that behavior into something useful. For the creator and for the audience.

    The Problem With Modern Engagement Loops

    But here is the honest part. Not everything about engineered engagement is good.

    When every creator is doing “comment PART 2,” the comment section starts to feel like a vending machine. Transactional. Hollow. People comment the keyword because they want the thing, not because they actually care. The conversation looks real on the surface, but there is no genuine exchange happening underneath.

    Fake urgency has become a plague. “Last 24 hours to get this.” “Only 3 spots left.” “You need to see this before it’s gone.” When everyone uses the same tricks, the tricks stop working. And worse, they start to erode trust.

    The brands that are going to win long-term are not the most automated. They are the ones that combine scalable systems with genuine interaction. They use the tools to handle volume, but they show up personally when it matters. They respond to comments like humans, not robots. They build systems that serve real relationships, not systems that simulate them.

    Automation is a multiplier. But you have to start with something worth multiplying.

    What Brands Are Still Measuring Wrong

    Most brand social media reports still look the same. Impressions this month. Follower growth. Reach. Views. Maybe engagement rate as a percentage.

    These numbers feel safe because they are easy to explain. “We reached 400,000 people this month.” Great. But did any of them care? Did any of them come back? Did a single one of them feel like they were part of something?

    The old metrics were built for broadcasting. Count how many people you reached. The new metrics need to be built for participation. Measure how many people responded, returned, and brought their friends.

    Reach without participation has limited value. You can pay for reach. You can buy impressions. What you cannot buy is a community of people who genuinely give a damn about what you do.

    The New Metrics That Actually Matter

    So what should you be measuring instead? Here are the signals that tell you whether your social presence is actually building something.

    💬 Comment depth Conversation quality
    🔁 Repeat commenters Returning voices
    🔖 Save behavior Intentional interest
    💌 DM conversions Relationship signals
    📈 Engagement velocity How fast response grows
    🎯 Sentiment quality What people feel

    Repeat commenters tell you that someone is coming back because they want to be part of what you are building, not just because an algorithm served your post. Save behavior tells you that someone valued your content enough to want it again later. DM conversions tell you that a public interaction turned into a private relationship, which is where trust really lives.

    Engagement velocity tells you whether your content is sparking something that compounds. A post that gets 50 comments in an hour and then builds to 300 over three days is a very different beast from a post that gets 300 comments once and goes silent. The first one has momentum. The second one is just a spike.

    These are participation signals. And they are the most honest picture of whether your social presence is actually working.

    Where Bluekona Fits Into All of This

    This is exactly the problem Bluekona was built to solve. Not just what gets seen, but what actually creates participation and builds community momentum over time.

    Detects meaningful engagement patterns

    Identifies what sparks real discussion, what creates recurring interaction, and what your audience emotionally responds to.

    Tracks participation beyond vanity metrics

    Measures comment behavior, engagement depth, audience return patterns, and participation consistency over time.

    Finds your compounding content

    Shows which themes build communities, which formats sustain interaction, and what creates recall instead of a one-time spike.

    Answers the questions that matter

    Not just “how many views did this get?” but did people care, did they participate, did conversations continue, did the community strengthen?

    Why Viral Reach Is Becoming Less Valuable

    Here is a slightly uncomfortable truth that the industry does not talk about enough. Going viral is not what it used to be. Ten years ago, viral meant something. It meant your content broke through, that millions of people chose to share it, that you had captured something real about a cultural moment.

    Today, viral can mean an algorithm pushed your content to a cold audience who scrolled past it in 2 seconds, boosted by a spike of passive eyeballs that evaporated the next morning and left nothing behind. No new followers. No conversation. No community. No recall.

    Visibility without participation is increasingly hollow. You can have a post that reaches 5 million people and builds less lasting value than one that reaches 50,000 people who feel genuinely connected to what you do.

    The brands that understand this are shifting their goal. Not just: reach as many people as possible. But: reach the right people, and give them a reason to respond, return, and recruit others. That is a compounding strategy. That is how communities actually form.

    What This Means for You Right Now

    If you take one thing from all of this, let it be this: the social media game has moved. The old scorecard is broken. Follower counts, raw views, and passive impressions are not the full story anymore, and optimizing for them alone is increasingly a path to spinning your wheels without going anywhere.

    The new game is participation. It is about creating content that people feel compelled to respond to. It is about building systems that turn responses into relationships. It is about measuring the things that actually compound over time, repeat visitors, deep conversations, saves, DMs, community momentum.

    This does not mean you stop caring about reach. Reach still matters. But reach is the starting point, not the finish line. What you do with that reach, how you turn passive eyeballs into active participants, that is where the real value is built.

    The brands that figure this out now will have an enormous head start. Because right now, most of their competitors are still chasing the old numbers. And while they are busy counting followers, the smart brands are building communities that will still be showing up three years from now.

    Stop measuring only visibility

    Understand what actually drives participation. Build communities, not vanity metrics. Measure what compounds.