Tag: social media audit

  • How Agencies Can Use AI Audits to Win and Retain More Clients

    How Agencies Can Use AI Audits to Win and Retain More Clients

    Client churn is the quiet tax every agency pays. In 2026, that tax has gotten steeper. Social media agencies are losing clients faster than almost any other service specialization, and the reasons are shifting under everyone’s feet. Brands are pulling creative work in house. AI tools promise to make execution cheap and replaceable. And clients are leaving over dissatisfaction that agencies rarely see coming until the cancellation email arrives.

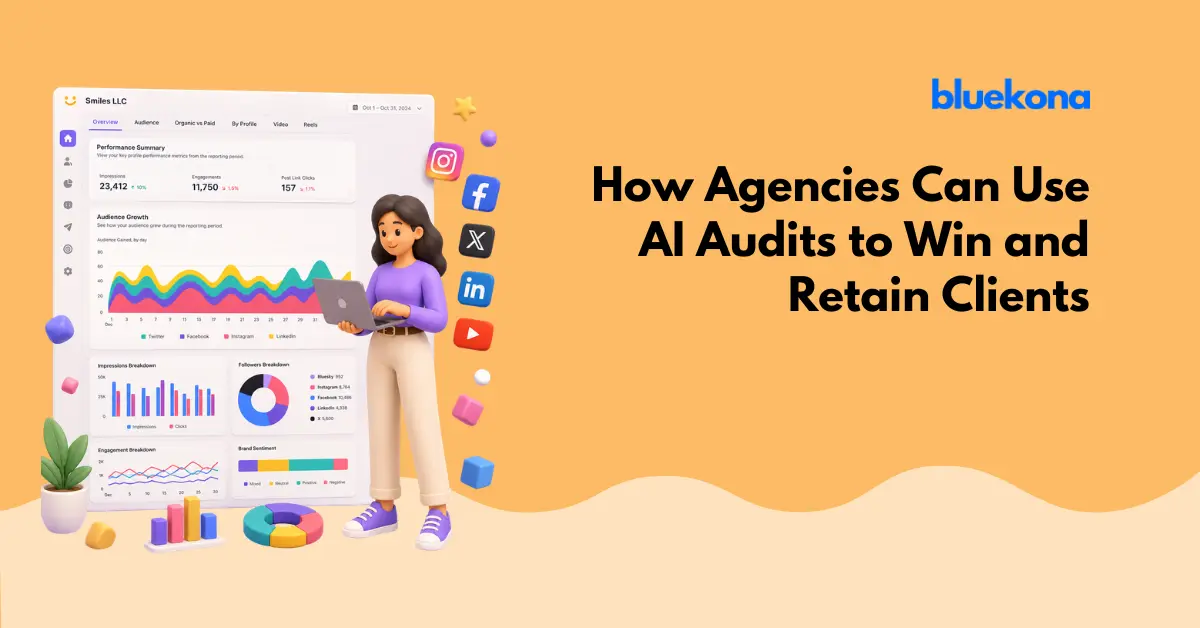
    The agencies pulling ahead this year are not the ones running from AI. They are the ones using it in the one place it actually protects the relationship, the audit. A well-run cross-platform audit does something a status report never can. It proves strategic value, catches problems before they turn into cancellations, and gives an account manager a real reason to walk back into a client’s inbox with something worth reading.

    This piece breaks down why agencies are churning faster in 2026, why not every AI use case pays off the same way, and how to build audits into a retention engine your clients actually notice.


    Why Agencies Are Losing Clients Faster Than Ever in 2026

    Social media agencies now face 46% annual client churn, second only to paid media agencies at 49%, according to Focus Digital’s 2026 Agency Churn Report. That number sits inside a bigger shift. Two forces are driving it, and most agencies are only prepared for one of them.

    46%
    Annual churn for social media agencies, second highest of any specialization
    Focus Digital, 2026 Agency Churn Report
    48%
    Of departing clients cite dissatisfaction with delivery, up 14 points year over year
    Focus Digital, 2026 Agency Churn Report
    34%
    Lower annual churn for agencies using AI-powered churn prediction in year one
    Focus Digital, 2026 Agency Churn Report

    The In-House Threat

    Nearly a third of brands, 32%, expect to bring all their creative work in house within the next 12 months, according to the same Focus Digital report. That threat lands hardest on agencies that position themselves as execution shops. If your value proposition amounts to “we post content and send a recap,” a marketing hire with an AI subscription can replicate most of that within a few months. Agencies that survive this shift are the ones clients see as strategists, not vendors.

    The Delivery Gap Nobody Sees Coming

    The more surprising number is this one. 48% of clients who left an agency in 2026 cited dissatisfaction with delivery as the reason, up 14 percentage points from the year before. Agencies, meanwhile, ranked delivery dissatisfaction seventh on their own internal list of churn risks. That gap between what clients feel and what agencies notice is where most preventable churn happens.

    The clients most likely to leave are not complaining loudly. They are quietly comparing your monthly recap to what an AI tool could generate for a fraction of the cost.

    Not All AI Use Is Equal

    Agencies rushed into agentic AI over the last 18 months, and the payoff has been wildly uneven. A 2026 survey of 250 marketing and development agencies by Digital Applied found that audit-style workflows return an 11.4x median ROI, the highest of any agentic use case measured. Client report drafting, the most common agency AI use case, returned just 1.6x, the lowest of the seven workflows studied.

    The gap makes sense once you think about what each workflow actually replaces. Report drafting automates work that was already low value to the client. Audits replace hours of senior strategist time spent analyzing what is genuinely working, and clients pay full rate for that kind of insight. One workflow makes an agency look more replaceable. The other makes it look indispensable.

    Audit-led AI use

    Diagnosis clients pay for

    Surfaces insights across platforms that clients cannot get on their own, gives account managers something new to say every month.

    11.4x median ROI
    Report-only AI use

    A recap clients already skim

    Automates a summary the client barely reads and changes nothing about the strategy underneath it.

    1.6x median ROI
    Delphi, Bluekona AI mascot

    Nobody canceled a retainer because the report was not pretty. They canceled because the report told them nothing they didn’t already know.

    How Cross-Platform Audits Become a Retention Engine

    A cross-platform audit, one that pulls signal from YouTube, Instagram, Facebook, and Threads into a single set of AI-generated recommendations, does three jobs a status report never will. It wins the pitch. It catches churn before it starts. And it proves an agency is directing strategy, not just executing tasks.

    Winning the Pitch

    Prospects rarely choose an agency based on a proposal deck alone. A live audit of their current social presence, run before the first call, gives a team something no competitor pitch has, specific proof that the agency already understands the business. Manual audits take days and rarely survive past the first draft. An AI-generated audit takes minutes and gives the team the rest of the week to build a strategy around it instead of a spreadsheet.

    The 30, 60, 90 Day Check In

    Focus Digital’s churn data shows retainer clients lose about 8% of accounts in the first six months, with project-based clients losing nearly 28% in that same window. The first 90 days decide more relationships than any other stretch of the engagement. Running an audit at day 30, 60, and 90, rather than waiting for the quarterly business review, gives an account manager a natural reason to show measurable movement early, before doubt has time to set in.

    Proving Strategy, Not Just Execution

    The agencies most exposed to in-housing are the ones whose only visible output is content and a recap. Audits shift the conversation. Instead of “here is what we posted,” the conversation becomes “here is what the data says to do next, and here is why.” That distinction is exactly what separates a strategic partner from a vendor a client can eventually replace with a junior hire and a chatbot. Scaling strategy with AI only works if the AI output looks like strategy, not just automation.

    Waiting for the quarterly review to prove your value is like waiting for the tide to come in after the boat’s already left the dock.

    Delphi, Bluekona AI mascot

    Building an Audit-Led Service Layer With Bluekona

    Bluekona was built for exactly this workflow. It runs cross-platform audits across YouTube, Instagram, Facebook, and Threads, then turns the raw data into AI-generated insights an account manager can hand a client without translation. Instead of pulling metrics by hand or hiring a dedicated analyst, agencies use Bluekona to package proof of value into every pitch, every 30/60/90 day check in, and every renewal conversation.

    The AI-powered content repurposing layer matters here too. An audit that only diagnoses a problem leaves a client wondering what happens next. Bluekona pairs its findings with specific repurposing recommendations, so the “here’s what’s wrong” conversation always comes with a “here’s what we do about it” answer attached. That combination, diagnosis plus a concrete next step, is what turns an audit from a nice report into proof a retainer is worth renewing.

    For agencies juggling a dozen or more client accounts, the workspace model matters as much as the audit itself. Bluekona lets a team run every client’s cross-platform audit from a single dashboard, rather than logging into four different native analytics tools per client and stitching the numbers together in a spreadsheet. That structure is what makes the 30/60/90 day cadence realistic at scale. An account manager covering ten clients cannot manually rebuild a full audit for each one every month, but pulling an updated AI-generated audit from an existing workspace takes minutes, not a full afternoon per client.

    There is a hiring angle here too. As junior analyst and reporting roles compress across the industry in favor of AI-assisted workflows, agencies still need someone directing the strategy those audits point toward. Handing a strategist a clean, AI-generated audit instead of a pile of raw exports frees that person to spend their time on the part of the job a client is actually paying for, judgment.

    A Simple Framework for Rolling This Out This Quarter

    An agency does not need to rebuild its entire service model to start using audits as a retention tool. Four steps get most teams from pilot to habit inside a single quarter.

    TimelineActionFocus
    Weeks 1 to 2Run baseline audits across every active client’s core platformsFoundation
    Weeks 3 to 4Lead every new prospect call with a live audit instead of a template deckQuick win
    Month 2Build a standing 30, 60, and 90 day audit cadence into onboardingRetention
    Month 3Use quarter-over-quarter audit data as the backbone of renewalsScale

    Agencies are not losing clients because AI got better. They are losing clients because the gap between what agencies deliver and what clients now expect got wider, and audits are the fastest way to close it. The agencies still standing in 2027 will be the ones who used AI to prove strategic value quarter after quarter, not the ones who used it to draft a slightly faster status update.
    See what an AI-powered audit shows your next client

  • How to Benchmark Your Social Media Performance Against Competitors

    How to Benchmark Your Social Media Performance Against Competitors

    There is a quiet assumption most SMBs make about social media. They assume that if their numbers are going up, their strategy is working. But going up compared to what? If your competitors are growing twice as fast and you have no idea, you are not winning. You are just not watching the scoreboard.

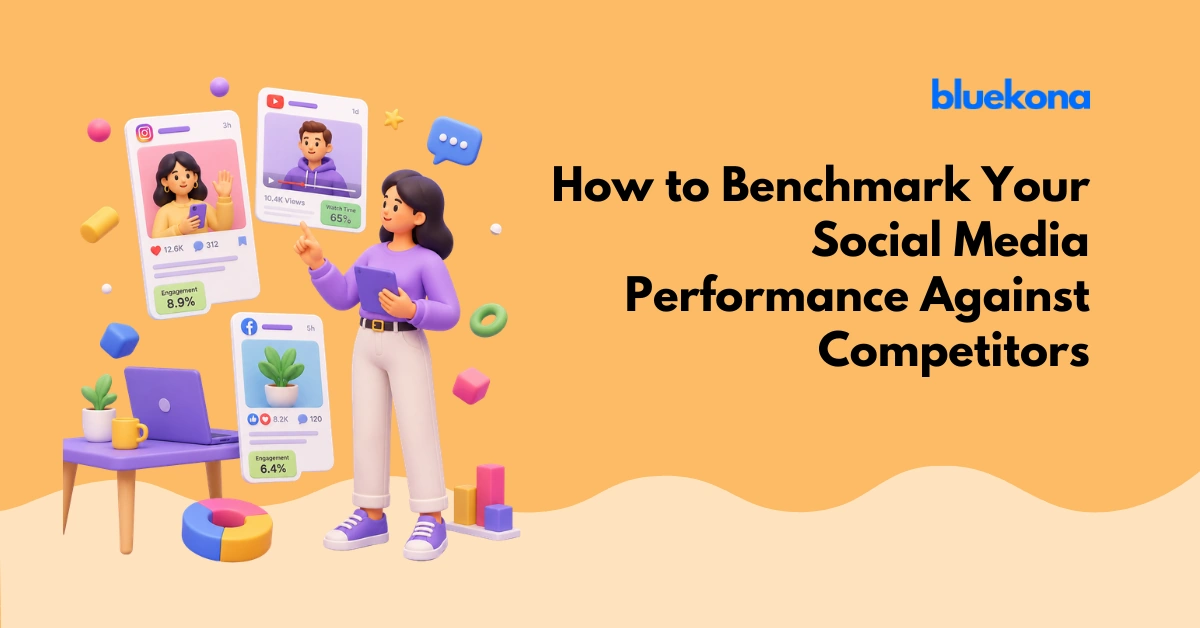
    Competitive benchmarking is how you fix that. It is the process of measuring your social media performance against similar brands so you can set realistic goals, spot gaps in your content strategy, and stop making decisions based on gut feel. The good news is that you do not need a data team, a six-figure analytics subscription, or a full-time analyst to do it well. You need a clear framework and the discipline to use it consistently.

    Why Most SMBs Skip This Step

    The most common reason small businesses skip competitive benchmarking is time. Running a business is already a full-time job, and carving out extra hours to analyze what competitors are doing on social media feels like a luxury reserved for marketing teams with actual headcount.

    The second reason is information overload. Social media platforms produce enormous amounts of data, and without a clear framework, most of it feels useless. Marketers know they should be tracking something, but they are not sure what. The result is that most small business social accounts get optimized in isolation. They get better at what they are already doing but miss the larger strategic picture. That gap is an opportunity for any brand willing to look.

    What Competitive Benchmarking Actually Measures

    Benchmarking is not about counting your competitor’s followers and feeling either relieved or jealous. It is about identifying patterns in how they are growing, which content formats are working for them, and where gaps exist in their strategy that you can fill. There are five metrics that actually move the needle in a benchmarking analysis.

    Engagement Rate

    Follower counts are the most visible metric and the least useful for benchmarking. A brand with 50,000 followers and 0.2% engagement is reaching fewer people effectively than a brand with 8,000 followers and a 3% engagement rate. Engagement rate gives you a normalized measure of how actively an audience is responding to content. For Instagram, the industry average sits at roughly 0.47% for business accounts, according to Rival IQ’s 2025 Social Media Industry Benchmark Report. Facebook averages significantly lower. When you see competitors consistently outperforming the industry average, that is a signal worth investigating. When they are underperforming it, that is a gap you can fill.

    The problem with most social media metrics is that raw numbers hide the real story. Engagement rate, normalized by follower count, is one of the few metrics that cuts through the noise.

    Posting Frequency and Consistency

    Algorithms on every major platform reward consistency. A brand that posts three times per week every single week will typically outperform a brand that posts ten times one week and then goes quiet for two. Benchmarking posting frequency helps you answer a key question: are you showing up at the same pace as the brands competing for the same audience? If competitors are posting five times per week and you are posting twice, the algorithm is giving them a systematic advantage.

    Follower Growth Rate

    Total follower count is a lagging indicator. Growth rate tells you momentum. If a competitor is growing their Instagram following by 4% per month and you are growing at 1%, that gap will compound quickly. Track growth as a percentage, not a raw number. A brand adding 500 followers a month from a base of 5,000 is growing at 10% monthly. A brand adding 5,000 followers from a base of 500,000 is growing at 1%. The first brand is winning, even though the raw numbers say otherwise.

    Content Format Mix

    Platforms shift what they reward over time. In 2024, short-form video dominated almost every feed. By mid-2026, carousels have made a significant comeback on Instagram, and YouTube’s algorithm is weighting community posts more heavily alongside Shorts. Look at what format mix your competitors are using and which format generates the most engagement within that mix. If they are getting 3x more engagement on video than on static posts, and you are still leading with static images, that is an actionable insight.

    Response Time and Community Activity

    This one gets overlooked almost universally. How quickly a brand responds to comments, questions, and DMs signals how seriously they treat their community. Slow response time trains audiences to stop engaging. If your competitors are replying to comments within hours and you are responding three days later – or not at all – you are not just losing engagement. You are losing the trust that turns followers into buyers.

    Delphi, Bluekona AI mascot

    Benchmarking without context is just professional envy dressed up in a spreadsheet. Pick the right peers and the data actually tells you something useful.

    Where to Find Competitor Data

    The best starting tools for competitive social media benchmarking are free and built directly into the platforms. You do not need a premium subscription to get started. What you need is a structured process for gathering information consistently.

    What the Platforms Tell You for Free

    Facebook and Instagram let you see a competitor’s posting frequency, page transparency information, and top-performing ads if they are running paid content via the Meta Ad Library. LinkedIn company pages show follower counts and recent post activity. YouTube surfaces subscriber counts, total views, and posting history directly on any channel’s About tab. For Instagram specifically, look at the engagement on each individual post. Count comments, note whether the brand is responding to them, and observe which content types are generating the most saves and shares.

    Manual Spot Checks That Actually Work

    Pick two or three direct competitors and spend around thirty minutes each month doing a structured spot check. Note their last ten posts and the engagement each one received. Track any new content formats they have introduced, the topics they are covering that you are not, and how they frame their calls to action. Build a simple spreadsheet to track this over time. Even a basic month-to-month comparison will reveal patterns that meaningfully inform your own strategy.

    The Ceiling of DIY Benchmarking

    Manual benchmarking gives you snapshots, not trends. You can see what a competitor posted this week but you cannot easily see how that compares to their performance six months ago. You also cannot benchmark across multiple platforms simultaneously without either the right tool or a significant investment of time. This is where the gap between manual effort and AI-powered auditing becomes most visible.

    0.47%
    Average Instagram engagement rate for business accounts in 2025
    72%
    Marketers who say competitive benchmarking meaningfully improves their content strategy decisions
    3x
    More consistent engagement seen by brands posting on a regular weekly schedule vs. sporadic bursts

    Platform Benchmark Reference

    Platform Avg Engagement Rate Recommended Posting Frequency Top Format in 2026 Ease of Benchmarking
    Instagram 0.47% 4 to 7 times per week Reels and Carousels Medium
    Facebook 0.12% 3 to 5 times per week Short Video Easy
    YouTube 2.1% * 1 to 3 times per week Long-form and Shorts Medium
    Threads 0.9% Once to twice daily Text Threads and Images Easy

    * YouTube engagement is measured as combined likes and comments relative to views, not follower count. Benchmark figures sourced from Rival IQ 2025 and Sprout Social 2025 industry data.

    The Benchmarking Trap You Need to Avoid

    The single most common benchmarking mistake is comparing yourself to brands at a completely different stage of growth. A local bakery should not benchmark against national QSR chains. An independent fitness coach should not compare follower growth rates against a VC-backed fitness app. These comparisons will either create false security or demoralize you with an impossible gap.

    The Right Peer Group

    Find two to five brands that are genuinely comparable – similar size, similar audience, similar growth stage, and similar product or service category. Your benchmark group should be aspirational but not fictional.

    This same logic applies to metrics. If a competitor has a massive legacy following built over five years, comparing your month-over-month follower growth to theirs will tell you nothing useful. What you can compare is their engagement rate, their content format mix, and their community response time – metrics that are independent of account age and legacy size. Running a proper social media SWOT analysis alongside your benchmarking exercise helps you put the competitive data in context and identify where you actually have an edge.

    Setting Benchmarks That Are Actually Useful for Your Stage

    Before you benchmark against competitors, run an audit of your own performance first. Your historical data is your most honest baseline. Where were you three months ago on engagement rate? What about six months ago on follower growth? Comparing your current performance to your own past performance gives you a growth trend line. Comparing that trend to comparable competitors shows you whether your growth is keeping pace with the market, falling behind, or actually pulling ahead.

    If you have not audited your own accounts recently, that is the right starting point. Bluekona’s audit tools walk through your Instagram performanceFacebook page metrics, and YouTube data in a single session, giving you the baseline numbers you need before any competitive comparison makes sense.

    Delphi, Bluekona AI mascot

    The right benchmark is the brand that is one step ahead of where you are right now. Not the brand you aspire to be in five years. Not the market leader with a full marketing team. The brand just above your current waterline.

    Benchmark Right
    • Pick 3 to 5 brands at a similar follower count and growth stage
    • Track the same 5 metrics each month for consistency
    • Focus on trends over time, not single-data-point snapshots
    • Use findings to set specific 30 to 90 day improvement targets
    • Audit your own historical data first before comparing externally
    Common Mistake
    • Compare against market leaders with large teams and legacy audiences
    • Check a competitor once, then assume their numbers stay static
    • Treat follower count as the primary success metric
    • Collect benchmarking data but never convert it into a specific action
    • Benchmark one platform while ignoring how competitors perform across all of them

    How AI Changes the Benchmarking Game for SMBs

    Manual benchmarking is better than no benchmarking at all. But it has real limits. It is time-consuming, it gives you incomplete snapshots rather than full trend lines, and it becomes increasingly impractical as you try to track multiple platforms and multiple competitors simultaneously. Most founders and small-team marketers find that manual benchmarking gets deprioritized within a month or two because it simply does not fit into an already packed week.

    AI-powered social media auditing tools change the equation. Instead of manually checking competitor pages and logging data into spreadsheets, you get cross-platform performance data surfaced automatically, with pattern recognition layered on top. The AI does not just show you numbers – it tells you what the numbers mean relative to your own performance trend and relative to what similar brands are doing. That is the difference between a data export and an insight you can actually act on.

    More importantly, AI benchmarking runs continuously. You are not working from a snapshot taken on one Monday in March. You are working from a living picture of your competitive landscape that updates as the market shifts. This matters because social media moves fast. A content format that was underperforming three months ago might be the platform’s current favorite. A competitor that was stagnant might have pivoted and is now growing at a pace that warrants attention. The brands that catch those shifts early are the ones that track content performance across platforms without waiting for a quarterly review cycle to notice what changed.

    Delphi, Bluekona AI mascot

    Your best benchmark is your own performance from 90 days ago. External data just tells you whether you are swimming faster or slower than the brands around you. Both answers are useful.

    From Benchmark to Action

    A benchmarking exercise that ends with a spreadsheet is a waste of time. The goal is to convert insights into a specific list of changes you are going to make in the next 30 days. If benchmarking reveals that your engagement rate is below the industry average, the next question is why. Look at your content format mix. Look at how you are opening your posts – the first sentence of copy determines whether someone stops scrolling or keeps moving. Look at whether you are posting consistently or going quiet for stretches that train the algorithm to deprioritize your account.

    If benchmarking reveals a competitor is growing followers twice as fast as you, look at what they are doing that you are not. Are they collaborating with micro-influencers? Are they posting at a different cadence? Are they actively responding to comments in a way that drives further conversation? The benchmark gives you the “what.” The audit gives you the “why.” The action plan gives you the path forward. Bluekona is built to help you run all three steps without needing a dedicated analyst sitting between you and the data.

    Start Here This Week

    Pick two direct competitors at a similar growth stage. Spend 20 minutes checking their last 10 posts across your shared platforms. Note engagement rates, format mix, and response activity. Then compare those numbers to your own last 10 posts. That gap is your first actionable benchmark.

    Social media growth without competitive context is just hope with a posting schedule. When you know how you stack up, you can make decisions that are grounded in data rather than intuition. And when you run that benchmarking process through an AI-powered audit rather than manually, you get a view that is faster, more complete, and more useful for the volume of decisions a small team needs to make every week.

    Social media growth without competitive context is just hope with a posting schedule. When you know how you stack up, you can make decisions that are grounded in data rather than intuition. And when you run that benchmarking process through an AI-powered audit rather than manually, you get a view that is faster, more complete, and more useful for the volume of decisions a small team needs to make every week.

    See How You Stack Up Against Competitors. Run a free AI-powered social media audit across YouTube, Instagram, Facebook, and Threads. Get the benchmarking data you need without the manual work.

  • Your Threads Strategy Is Missing This One Thing (And Your Audit Will Prove It)

    Your Threads Strategy Is Missing This One Thing (And Your Audit Will Prove It)

    Here’s a quick question. When did you last post on Threads? If you had to think about it for more than three seconds, you already know something is off. Most SMB owners have the same Threads story. They signed up, posted a few times, noticed nothing much happened, and quietly moved on. The account exists. It just doesn’t do anything. The platform isn’t the problem. The strategy is.

    400M+
    Monthly active users by Aug 2025
    6.25%
    Median engagement rate, vs 3.6% on X
    127.8%
    YoY growth in daily active users through June 2025

    Threads crossed 400 million monthly active users by August 2025, up from 275 million just eight months earlier. Daily active users surpassed X on mobile for the first time in 2025. This is not a dying platform. This is a platform where most brands are simply showing up wrong. The thing they’re missing isn’t more content. It’s conversation.

    Threads Is Growing Fast – But Most Brands Are Treating It Like a Leftover

    When Threads launched in 2023, a lot of brands treated it as an Instagram overflow channel. Post the same content, same captions, same graphics. What happened, mostly, was nothing.

    Threads has its own tone, its own rhythm, and its own algorithm. Brands that mapped Instagram habits onto it found that polished graphics underperformed. Scheduled batches of promotional content got ignored. Follower counts crept upward without any meaningful engagement behind them.

    The platform rewards something that most social media workflows aren’t built to produce at all.

    Delphi, Bluekona AI mascot

    Most brands treat Threads like a party where they post a flyer on the door, stand in the corner checking their phone, and then wonder why nobody came over to talk. Showing up is not a strategy. Showing up and saying something is.

    The One Thing Most Threads Strategies Are Missing

    The missing piece isn’t a content calendar, a hashtag strategy, or better visuals. It’s replies. Specifically, replies per post – which the Threads algorithm weights more heavily than any other signal as of mid-2025, according to RecurPost and Metricool.

    The gap in plain terms – Most brands treat Threads like a broadcast channel. They post, move on, and check back in a week. The algorithm sees zero conversation activity and stops pushing the content beyond existing followers. The gap is not the quality of what you post. It’s what happens after.

    Why the Algorithm Weights Replies So Heavily

    By mid-2025, Meta shifted the For You feed toward a recommendation-driven model that surfaces content based on engagement signals, topic relevance, and conversation quality rather than follower count. This is significant for small brands. A brand with 500 followers can reach thousands of people if the conversation on their post is active enough.

    The flip side is equally true. A brand with 50,000 followers and a ghostly comment section will reach almost nobody outside their existing audience.

    What Brands Actually Get Wrong When They Show Up on Threads

    Beyond the reply issue, there’s a tone problem. Threads rewards candid, direct, slightly unpolished communication that feels like a person wrote it rather than a content team. Over-produced content and generic brand-voice copy underperform consistently.

    If you want to understand what hooks actually work in that first moment of attention, the same principle applies on Threads as anywhere else – read more in our breakdown of the first 3 seconds of a social media post.

    What doesn’t work

    Repurposed Instagram graphics, scheduled promotional captions, one-way announcements with no question or hook, link posts that push users off-platform.

    What works

    Direct opinions, industry observations, questions that invite pushback, behind-the-scenes text posts, replies to niche accounts with real audiences.

    Threads does not care how many times you posted this week. It cares how many conversations you started. There is a significant difference between those two things, and your reach will tell you exactly which one you have been doing.

    Delphi, Bluekona AI mascot

    What a Threads Audit Actually Reveals

    Most brands assume they know what they’re doing on Threads. The audit usually reveals something more honest, and occasionally more humbling. The gap between what you think your posting cadence looks like and what the data actually shows tends to be wide.

    If you’ve wondered whether an AI-powered audit is faster and more accurate than pulling the data yourself, we covered that comparison in depth in this breakdown of AI vs manual social media audits.

    Posting Cadence and Consistency Gaps

    The first thing an audit surfaces is your actual posting frequency versus what you remember posting. Most accounts think they post more often than they do. Significant gaps – sometimes weeks without activity – reset any momentum the algorithm had built. Consistency beats volume. Posting twice a week reliably outperforms ten posts in one week followed by three weeks of silence.

    Content Format Performance

    Threads supports text posts, photos, links, and videos. They don’t all perform equally. Most SMBs lean too heavily on link posts, which get the least traction because they ask users to leave the platform.

    Format Engagement Performance Reach Impact
    Photos Best performer 60% above text-only
    Text posts Solid Good when conversational
    Videos Variable Strong when short and native
    Link posts Lowest 37% below photos

    WebFX, 2025 Threads Marketing Benchmarks

    Reach vs Engagement Disconnect

    This is the finding that surprises people most. It’s possible to have a healthy engagement rate on Threads and still have flat or declining reach. Strong likes and reposts from existing followers keep your rate looking decent. But if nobody outside your circle is continuing conversations you started, the algorithm won’t push your content to new audiences. Reach growth on Threads requires outbound conversation activity, not just good content waiting to be noticed.

    Delphi, Bluekona AI mascot

    The audit does not lie. Your engagement rate looks fine because your existing followers are loyal. Your reach is flat because you have not talked to anyone new. Those are two very different problems, and only one of them shows up when you just check your notifications.

    What a Winning Threads Presence Looks Like for an SMB

    Tone and Voice – Personality Over Polish

    Threads users respond to content that sounds human. Shorter sentences, direct opinions, questions, observations, and the occasional take that invites pushback. You don’t need a design team or a videographer. You need a point of view and the willingness to express it. A local bakery posting “Sourdough starter that’s three years old hits different in winter. Anyone else notice this?” will outperform a branded promotional graphic every single time.

    The Reply Strategy That Expands Your Reach

    The most efficient thing you can do on Threads isn’t post more. It’s reply more. Reply to your own posts when people comment. Reply to posts from accounts in your niche. Start conversations in the replies of larger accounts whose audiences overlap with yours.

    The 15x reach multiplier – Companies that enable team members to engage with branded content on Threads see 10 to 15 times the organic reach of brand account posts alone, according to inBeat Agency’s 2026 research. Even solo founders who block 10 to 15 minutes daily for Threads replies – not posting, just responding – tend to see measurable reach growth within two to three weeks.

    Cross-Platform Leverage From Your Instagram and Facebook Presence

    If you already have an active Instagram or Facebook account, Threads has a structural advantage built in. Meta’s ecosystem makes cross-promotion between platforms easier than anywhere else. Your existing audience can follow you on Threads with minimal friction, and Meta’s infrastructure treats activity across all its platforms as connected signals.

    For SMBs that have spent years building a Facebook or Instagram following, Threads is one of the highest-leverage organic platforms available right now. The foundational work is already done. You can see how this connects to a broader cross-platform approach in our Facebook Business Page audit guide, which covers what cross-platform data reveals when you audit together rather than in silos.

    How to Use Your Audit Results to Fix It

    A complete Threads audit should surface five things. Your posting frequency and consistency over the past 90 days. Your content format breakdown and how each format performs for your specific account. Your average engagement rate versus platform benchmarks. Your reply rate when people engage with you. And how your reach has trended over time.

    From there, the fix is straightforward. Inconsistent posting? Set a minimum of two posts per week and hold it before adding more. Link posts dragging engagement down? Replace them with photos or plain-text observations. Reply rate near zero? Block fifteen minutes a day for engagement only – no posting, just responding.

    Once you know which content formats are working on Threads, the next step is to build those formats into a repurposing workflow so the same insight can work across your other platforms. Our guide on measuring the ROI of content repurposing walks through how to connect those dots, and our social search strategy and repurposing workflows post shows what that looks like in practice.

    Act before the window closes – Meta launched Threads ads globally in January 2026. When platforms move from growth to monetization, organic reach tightens in the months that follow. Brands with strong engagement signals baked in now will hold their reach better than those who wait. The window is still open. It won’t stay that way.

    BluekonaAI runs cross-platform audits across Threads, Instagram, Facebook, and YouTube, surfacing your actual cadence gaps, format performance, and reach trends in minutes.

  • How Snack Founders Can Turn One Chip Bag into 10,000 Views

    How Snack Founders Can Turn One Chip Bag into 10,000 Views

    The snack aisle is now digital. Your next customer probably saw your chips on TikTok before they ever spotted them on a grocery shelf. They craved your popcorn because an influencer made it look irresistible. They bought your protein bars because a Reel made them hungry at 11 PM.

    Here’s what’s wild: 93% of Americans regularly see food content on social media, and food-related posts make up nearly 40% of their feeds. That’s not background noise—that’s your battleground.

    Yet most snack solopreneurs are posting blind. They’re churning out content without knowing which posts actually drive cravings, clicks, or conversions. They’re guessing at strategy when they should be analyzing data.

    Without a social media audit, your content strategy is just expensive guesswork. And in an industry where 34% of U.S. consumers discover new snacks via social media—and 40% literally snack while scrolling—you can’t afford to guess.

    The big brands get it. Doritos has over 1 million Instagram hashtags. Oreo dominates with 9.7 million. Kit Kat sits pretty at 3.7 million. That’s not luck or legacy—it’s consistent, data-informed branding. And you can do it too.

    What a Social Media Audit Actually Does (and Why It Matters)

    Think of a social media audit as your marketing taste test. It’s a structured review that helps you understand your flavor of content performance—what’s working, what’s stale, and what deserves to be your signature recipe.

    For snack solopreneurs, an audit means knowing:

    • Which flavors, packaging shots, or product angles resonate most
    • Which videos or posts drive engagement spikes (and which ones fall flat)
    • Where your audience scrolls, comments, saves, and actually buys
    • How you stack up against competitors in the same category

    The purpose? To measure your brand awareness, audience demographics, and ROI across every platform—so you can turn scattered likes into a clear growth recipe.

    A social media audit helps snack founders stop throwing content at the wall and start building a system that feeds sustainable growth.

    How to Conduct a Social Media Audit (Step-by-Step for Snack Brands)

    Ready to get tactical? Here’s how to run an audit that’s quick, strategic, and realistic—no agency required.

    Step 1: Inventory Your Social Channels

    Start with a complete list of every account: TikTok, Instagram, YouTube, Facebook, even that Twitter account you started and abandoned in 2021. If it has your brand name on it, it matters. Dormant profiles can confuse customers and hurt your credibility.

    Step 2: Gather Post Performance Data

    Pull metrics on engagement rate, link clicks, saves, comments, and shares. Look at the last 90 days minimum—ideally six months if you’re seasonal (think summer snacks vs. holiday gift sets).

    Pro tip for snack brands: Categorize your content by theme. Analyze “flavor content” (spicy launches, sweet collabs, limited editions) versus evergreen posts (brand story, behind-the-scenes, product benefits). Which type actually moves the needle?

    Step 3: Identify Audience Insights

    Who’s actually engaging with your content? Dig into age, region, interests, and behaviors. Are you reaching protein-obsessed gym-goers? Late-night snackers? Parents looking for lunchbox options? Your product positioning should match who’s showing up, not who you hope shows up.

    Remember: 55% of Millennials and Gen Z consider themselves savvy snackers, with 32% turning to social media for snack inspiration. If you’re not showing up in their feeds with the right message, someone else is.

    Step 4: Compare Your Top-Performing Posts

    Which posts went viral, and why? Was it humor? Crunch sound ASMR? A trending audio? An influencer collaboration? Look for patterns across your winners.

    For younger generations, social media (73%), video content (71%), and food influencers (61%) are the primary ways they discover new snacks. If your top posts don’t leverage at least one of these formats, you’re leaving engagement on the table.

    Step 5: Run Competitor Checks

    Benchmark yourself against similar snack startups and established players like Lay’s, Pringles, Doritos, or Hershey’s (which generates over 1 million hashtags). What are they doing that you’re not? Where are they falling short that you could capitalize on?

    Look at their posting frequency, content mix, engagement rates, and how they’re riding trends. Are they leaning into health claims? Adventurous flavors? User-generated content? Steal what works, skip what doesn’t.

    Step 6: Identify Strengths, Weaknesses, Opportunities, and Threats

    Run a SWOT analysis on your social presence:

    • Strengths: What content formats consistently perform? Where do you overdeliver compared to competitors?
    • Weaknesses: Which platforms are you ignoring? What content types underperform?
    • Opportunities: Emerging trends you haven’t tapped (61% of Americans are open to trying sweet and smoky snacks—are you talking about this?)
    • Threats: Where are competitors dominating conversations you should own?

    Don’t forget the macro trends. “Better-for-you” snacks are driving 64.1% of consumer interest in 2025, with 55% pointing to protein as the most important health claim. If your audit shows you’re not addressing these demands, that’s a massive opportunity gap.

    Step 7: Build Your Audit Report

    Don’t let your findings die in a Google Doc. Summarize key takeaways and translate them into action: next month’s content themes, optimal posting times, platform priorities, and budget allocation.

    Better yet, skip the three-hour spreadsheet session entirely. bluekonaAI automates every step—tracking performance across TikTok, Instagram, and YouTube so you know exactly what’s working without manual data pulls, formula errors, or decision paralysis.

    What to Include in a Snack Brand’s Social Media Audit Report

    Your audit report should be lean but comprehensive. Focus on insights that change your strategy, not vanity metrics that stroke your ego. Include:

    Post Performance Metrics: Engagement rate, reach, saves, shares, and link clicks. Which posts actually drive action?

    Content Mix Analysis: Break down performance by content type—product shots, user-generated content, taste tests, recipe ideas, behind-the-scenes, trends. What ratio works best for your brand?

    Platform Breakdown: Understand what each platform does for you. TikTok drives trends and viral moments. Instagram showcases beautiful, “Instagrammable” visuals. YouTube hosts longer-form recipe content and reviews. Facebook connects with an older demographic looking for product info.

    Audience Insights: Demographics, active times, interests, and behaviors. Are you reaching the right people at the right moments?

    Top Influencers and Advocates: Who’s already tagging or mentioning your brand organically? These are your low-hanging fruit for partnerships and amplification.

    Growth Opportunities: Channels, content types, or topics you’re underutilizing. Maybe your ASMR crunch videos crush it, but you’ve only posted three. That’s actionable intel.

    From Data to Decisions: Turning Audits into Sales

    Here’s the truth: engagement is nice, but it doesn’t pay rent. Your audit should translate directly into demand and revenue.

    Identify viral potential. Which videos make people hungry enough to click “buy now”? A TikTok-fueled cottage cheese trend drove a 166% increase in Gopuff orders in 2024. That’s the power of turning social buzz into sales momentum.

    Use AI audit data to optimize everything. Align your posting frequency, timing, creative direction, and ad targeting based on what actually performs—not what you think should work.

    Discover which trends to jump on. The data shows consumers are increasingly adventurous (61% open to sweet and smoky combos) and health-conscious (64.1% seeking “better-for-you” options). If your audit reveals you’re not addressing these desires, pivot immediately.

    Understand the impulse purchase pathway. Over one-third (34%) of U.S. consumers discover new snacks via social media, and platforms with integrated shopping links facilitate impulse buys. Are you making it easy for people to go from craving to cart?

    Leverage emotional triggers. Research shows that viewing appetizing food images on social media activates the brain’s reward centers, increasing cravings and the likelihood of impulsive eating—especially for high-calorie items. Your content isn’t just informative; it’s neurological marketing.

    bluekonaAI’s automated social media audit helps solopreneurs move from post-and-pray to plan-and-grow. You get real-time insights, performance benchmarks, and content recommendations—without the manual labor.

    Skip the Template Trap

    Most “free social media audit templates” are just fancy to-do lists that eat up hours of your time. You download a spreadsheet, manually input data from five different platforms, create pivot tables, and by the time you’re done analyzing last month, you’ve already posted another 30 pieces of content you haven’t measured.

    That’s not efficiency. That’s busywork disguised as strategy.

    Instead of giving you a static template that makes you the data entry person, bluekonaAI runs your audit instantly. It auto-fills with live data, tracks changes over time, and highlights what actually matters—so you can spend your energy on creating crave-worthy content, not wrestling with Excel formulas.

    People Don’t Just Snack While Scrolling—They Scroll to Snack

    Let that sink in. 40% of Americans snack while scrolling social media, and nearly half (48.8%) consume three or more snacks daily. Your audience isn’t passively encountering your content—they’re actively hunting for their next flavor obsession.

    Social media isn’t just where people discover snacks. It’s where cravings start, trends explode, and purchase decisions happen in real time.

    If you’re a snack solopreneur competing against brands with million-dollar marketing budgets, you can’t outspend them. But you can outsmart them. A regular, data-driven social media audit gives you clarity on what’s working, what’s wasted effort, and where your biggest growth opportunities hide.

    You don’t need an agency. You don’t need a marketing degree. You need the right tool and the willingness to let data guide your decisions.

    Don’t Let Your Best Content Go Stale

    Every post you publish is either bringing customers closer or letting them slip away. The difference between growth and stagnation isn’t more content—it’s smarter content.

    bluekonaAI helps snack solopreneurs run faster, smarter social media audits that are free, automated, and built for growth. Stop guessing which posts work. Start knowing.

    Your next viral moment is hiding in your data. Let’s find it.

    Run Your Free Audit with bluekonaAI

    Stop posting blind. Start growing smart. With bluekonaAI, your social media audit is done before you even think about it—giving you more time to build the snack brand your audience is craving.