Tag: social media

  • Why Your Best Video Is Leaking Revenue (And How to Find It in 10 Minutes)

    Why Your Best Video Is Leaking Revenue (And How to Find It in 10 Minutes)

    Somewhere in your channel is a video that is doing everything right. Good views, strong retention, comments full of people asking where to buy the thing you mentioned. And somewhere in that same video is a missing tag, a dead link, or a description that never got updated, quietly handing money to nobody.

    You would notice if a sponsor stopped paying you. You are far less likely to notice a broken affiliate link sitting in a video that is still getting views a year later. That is the entire problem with revenue leaks. They do not show up as a dramatic drop. They show up as nothing at all, just money that was always supposed to arrive and never does.

    50%+ of affiliate revenue creators are entitled to gets lost to misattribution and broken redirects Button creator commerce data, cited 2026
    43% more clicks on tagged products when a timestamp is added alongside the tag YouTube internal data, January 2025
    71% year over year growth in shoppable video placements across YouTube, TikTok, and Instagram 2026 creator commerce industry data

    The Video That’s Working and Still Losing You Money

    Picture a mid-size cooking channel, a few hundred thousand subscribers, posting steady weekly recipes. One video, a fifteen-minute butter chicken tutorial, pulls in 2.4 million views. By every normal measure, that is a hit. Except when someone actually checks the video, three products mentioned on camera were never tagged. No affiliate link, no description mention, nothing for a viewer to click even if they wanted to buy the pan or the spice blend on screen.

    That is not a hypothetical. It is close to the exact situation Bluekona surfaces constantly when creators run their firstΒ channel audit, high performing videos sitting right next to a revenue gap nobody had gone looking for. The video is not underperforming. The monetization behind it is.

    What a Revenue Leak Actually Looks Like

    Missing Product Tags

    You mention a product on camera, maybe even show it, but never add the tag, the pinned comment, or the description link that turns that mention into a click. This is the most common leak, and it is almost always accidental. You are focused on the edit, the thumbnail, the title. Tagging every product mentioned in a fifteen-minute video is easy to forget.

    Broken or Expired Affiliate Links

    Retailers restructure their affiliate programs. Amazon updates its associate link format. A product gets discontinued and its page redirects somewhere useless. None of this shows up in your analytics as a problem. It just quietly stops paying out, sometimes for months before anyone notices.

    Untimed Tags on Your Highest-Retention Moments

    Even when a tag exists, where it appears in the video matters. A tag sitting in the description with no timestamp asks viewers to go hunting for it. A tag with a timestamp, placed right at the moment the product appears on screen, catches people while their interest is highest. The data backs this up clearly, tagged products paired with a timestamp get 43% more clicks than a description link alone, according to YouTube’s own internal figures from January 2025.

    Delphi, Bluekona AI mascot

    Creators are excellent at making things people want to watch. Most are terrible at bookkeeping. Both things can be true, and only one of them is costing you money.

    Why This Happens Even to Careful Creators

    Nobody sets out to leave money on the table. It happens because the work of making a video and the work of maintaining its monetization live on completely different timelines. You publish once. The video keeps earning, or should keep earning, for years. But nobody goes back and checks whether the affiliate program you joined two years ago still uses the same link format, or whether that discontinued product page is now redirecting to a 404.

    Channels growing fast feel this the most. More videos, more products mentioned, more affiliate relationships to track, and no time built into the schedule for checking any of it. The bigger the back catalog gets, the bigger the blind spot gets with it.

    How Much This Is Actually Costing You

    The scale here is bigger than most creators assume. Misattribution and broken redirects alone cause creators to miss more than half of the affiliate revenue they are technically entitled to, based on Button’s creator commerce data cited in 2026 industry reporting. Meanwhile creator affiliate revenue as a category grew 47% year over year in 2026 and now makes up 24% of total affiliate spend, up from just 11% in 2022, according to Awin’s 2026 affiliate marketing statistics. The pie is growing quickly. A leak in your share of it costs more every year it goes unfixed, not less.

    The Real Cost Isn’t the Missing Tag

    It’s the compounding effect. A video that keeps earning views for years also keeps losing the same untagged revenue for years. Fixing one video today is worth more than fixing ten videos five years from now, simply because of how much longer the fix has to work in your favor.

    The 10-Minute Audit

    This does not require new software or a weekend. It requires ten focused minutes and a willingness to actually click your own links.

    Step 1, Pull Your Top 20 Videos by Views

    Sort your channel by views, not by upload date. Your highest performing videos are where a small fix produces the biggest return, since they have the most eyeballs still landing on whatever tag or link sits underneath them.

    Step 2, Check Tags Against What You Actually Say

    Watch the first thirty seconds and skim the middle of each video. Note every product, tool, or brand you mention out loud or show on screen. Then compare that list against what is actually tagged in the description or pinned comment. Gaps show up fast once you are looking for them on purpose.

    Step 3, Click Every Link

    Not skim, click. A link that looks fine in the description can still redirect to a dead page, an out of stock listing, or a generic homepage instead of the actual product. This step alone catches most of the silent leaks in an older back catalog.

    Step 4, Flag and Fix

    Keep a simple list as you go, video, timestamp, what’s missing or broken. Fix the highest-view videos first. A single afternoon spent working through this list against your top twenty videos usually closes the biggest gaps in your entire channel.

    Checking your own affiliate links is not glamorous content. It is, without question, the highest return on ten minutes you will get all week.

    Delphi, Bluekona AI mascot

    Building a Habit So It Doesn’t Happen Again

    A one-time audit fixes today’s leak. It does not stop tomorrow’s. The creators who actually keep this under control build a small habit around it instead of treating it as a one-off cleanup project.

    Leak typeWhat it looks likeHow often to checkRisk if ignored
    Missing product tagsProduct shown or mentioned, no tag addedEvery new uploadHigh
    Broken affiliate linksLink redirects to a dead pageMonthly, top 20 videosHigh
    Untimed tagsTag exists only in descriptionQuarterly reviewMedium
    Outdated program linksOld link format no longer trackedWhen program terms changeMedium
    Discontinued products taggedTag points to a product that no longer existsTwice a yearLow
    Leaking revenue

    Tags added once at upload and never revisited. Links trusted forever. Older top-performing videos treated as finished, not as ongoing income.

    Healthy tagging habit

    Top videos re-checked on a schedule. Links clicked, not just glanced at. Every new upload tagged completely before it goes live, not fixed later.

    Running a habit like this manually across dozens or hundreds of videos is exactly where it falls apart for growing channels. This is the gap a properΒ YouTube channel auditΒ is built to close, one pass across your whole library instead of a mental note you keep meaning to act on.

    Your Back Catalog Is Still a Revenue Channel

    It is easy to think of monetization as something that happens at publish time and then stops mattering. The numbers say otherwise. 63% of global viewers say they have bought something they first discovered on YouTube, according to YouTube’s own Culture and Trends team, and shoppable video placements across YouTube, TikTok, and Instagram grew 71% year over year. Viewers are already primed to buy from video. The only question is whether your older content still gives them a working way to do it.

    Every video sitting in your back catalog with views still trickling in is a small, ongoing revenue channel, whether you are actively thinking about it or not. Treating your top twenty videos as something to audit and maintain, not something you finished the day you hit publish, is the difference between a channel that grows itsΒ return on existing contentΒ and one that keeps making new videos to replace the earnings the old ones quietly stopped delivering.

    Delphi, Bluekona AI mascot

    Your old videos didn’t stop earning because people stopped watching. They stopped earning because nobody went back to check on them. Big difference.

    Find Out Which of Your Top Videos Are Actually Leaking

    Run the free YouTube Channel Audit and see which of your videos are missing tags, carrying broken links, or sitting on untapped revenue right now.

  • AI Content Disclosure, Does Labeling AI-Assisted Posts Build Trust or Kill Reach?

    AI Content Disclosure, Does Labeling AI-Assisted Posts Build Trust or Kill Reach?

    Somewhere in your feed right now sits a caption that reads a little too polished and a little too fast to have been typed by hand. You scroll past without deciding whether a human or a tool wrote it, mostly because you cannot tell, and the brand that posted it never said either way.

    That uncertainty is the normal state of social media in 2026. AI tools have moved past the experimental phase inside marketing teams and into daily habit. 87% of marketers now use AI for social media, and 89.7% of social media professionals reach for an AI tool several times a week, according to Sociality.io’s 2026 AI in Social Media Marketing report. The tools are no longer a novelty. They are the default first draft.

    What has not settled is what brands owe their audience once that draft goes live. Do you say a caption started as a prompt. Do you mention a product image was generated instead of shot. The platforms are now answering that question whether marketing teams like it or not, and the consumer data on what happens next is messier than most teams expect.

    91% of consumers expect brands to disclose AI use in marketing, yet only 20% of brands always do Fractl, 2026 AI Search Consumer Trust Study
    31% say visible AI-generated content makes them trust a brand less, versus 7% who trust it more Fractl, 2026
    50% of Gen Z have unfollowed, muted, or blocked an account they believed was posting AI content Sprout Social, Q1 2026 Pulse survey

    Why This Question Won’t Go Away in 2026

    Every content calendar built this year runs into the same quiet decision point. A tool helped write this caption, clean up this photo, or generate this video clip. Saying so used to feel optional, almost like admitting you used a spellchecker. It no longer works that way.

    Platforms have started making the choice for brands, and audiences have opinions that do not sit still long enough to build a simple rule around. A founder posting three times a week does not have the bandwidth to run a research study before every post. What they need is a clear read on what the data actually says, and a workable policy they can apply without overthinking each caption. That is what the rest of this piece is built to give you.

    The tension worth naming early is this. Consumers say, loudly and consistently, that they want transparency. Then, in the same surveys and in controlled studies, they respond to visible AI labels by trusting the content less and engaging with it less. Holding both of those facts at once is uncomfortable, but it is also the actual situation SMB marketers are operating inside right now.

    Delphi, Bluekona AI mascot

    People say they want the truth about your content, then they get grumpy the second they actually see it. Welcome to marketing in 2026.

    What the Platforms Now Require

    Brands debating whether disclosure is worth the trust hit are increasingly finding the decision made for them. Each major platform has landed on a different enforcement model, and the differences matter for how much control a small team actually has.

    TikTok’s Automated Detection

    TikTok now requires visible labels on AI-generated visuals and audio that depict realistic people or scenes. The platform reads C2PA Content Credentials to catch synthetic media automatically, even when a creator skips the disclosure step entirely. After three unlabeled AI videos, TikTok cuts account reach by roughly 60% for 30 days and pauses Creator Fund earnings during that window.

    Meta’s In-Post Tag

    Meta unified its AI content rules across Instagram and Facebook in February 2026. Disclosure now has to appear as a tag above the post itself, separate from the caption, similar in placement to a paid partnership label. Burying an AI disclosure in the ninth line of a caption no longer satisfies the requirement.

    YouTube’s Manual Flagging

    YouTube still relies on creators to flag AI-generated content themselves, with penalties building for repeated failure to disclose. It is the least automated of the three systems, which puts more responsibility, and more room for judgment calls, on the creator.

    PlatformDisclosure methodDetectionPenalty for skipping it
    TikTokVisible label on synthetic visuals or audioAutomatedReach cut ~60% for 30 days after 3 violations
    MetaIn-post tag above the contentManualContent restrictions, tag added if missed
    YouTubeCreator-flagged disclosureManualEscalating penalties for repeat non-disclosure

    The Trust Data Is a Contradiction

    What Consumers Say They Want

    Ask people directly and the answer is close to unanimous. 91% of consumers expect brands to disclose when AI played a role in their marketing, according to Fractl’s 2026 AI Search Consumer Trust Study. Yet only 20% of organizations always disclose, and 33% never do. That gap between what audiences expect and what brands actually deliver is the real starting point for any disclosure policy.

    What Happens When They See the Label

    Here is where it gets uncomfortable. The same Fractl research found that only 7% of consumers say visible AI-generated content makes them trust a brand more, while 31% say it makes them trust the brand less. Wanting transparency in principle and rewarding it in practice turn out to be two different behaviors.

    The Real Question Isn’t Whether to Disclose

    Platforms have already removed “quietly hide it” as a viable long-term option. The actual decision left for SMBs is what to disclose, how specifically, and how that disclosure is worded, since those choices are what separate a trust-building label from a trust-damaging one.

    TikTok reading your content’s digital fingerprints means hiding AI use isn’t a strategy anymore. It’s just a risk you’re choosing to take.

    Delphi, Bluekona AI mascot

    Why Labels Sometimes Kill Reach (and Sometimes Don’t)

    Recent academic work on AI content labeling adds useful nuance to the blunt trust numbers above. Studies published through 2026 found that labeling content as AI-generated or AI-assisted reduced both emotional and behavioral engagement compared to unlabeled human-created content, especially for posts built around an emotional hook. Once someone knows a post came from a tool, they respond to it differently, often less warmly.

    But at least one study found a more encouraging pattern sitting underneath that headline result. Disclosure had a positive moderating effect on the relationship between content inauthenticity and engagement, meaning that when the underlying creative was strong, labeling it as AI-assisted protected engagement rather than tanking it. The label itself is not automatically the problem. A weak, obviously synthetic post that also gets labeled tends to underperform twice over. A strong, well-made post that gets labeled tends to hold up.

    This is the piece most SMBs miss when they read a scary headline about AI labels killing reach. The label is not erasing good content. It is removing the cover that let mediocre content coast on ambiguity. If you have been relying on your audience not noticing the difference, that grace period is closing. If you are using AI tools well, inside a realΒ content lifecycleΒ rather than as a shortcut around effort, disclosure is far less risky than it looks on paper.

    The Gen Z Problem

    The demographic split in this data deserves its own section because it changes the calculus depending on who your audience actually is. Half of Gen Z say they have unfollowed, muted, or blocked an account because they believed its content was AI-generated. That is not a mild preference. That is an active rejection behavior, and it is concentrated in exactly the age group most SMBs are trying hardest to reach on Instagram, TikTok, and Threads.

    Older audiences, by contrast, tend to respond more to whether the content is useful and well made than to whether a tool touched it along the way. A brand serving a 45-plus audience on Facebook is working with a very different risk profile than a brand chasing 19-year-olds on TikTok. Your disclosure policy should account for that split rather than applying one blanket rule across every platform you post on.

    A Disclosure Framework for SMBs (What to Label, What Not To)

    The distinction that actually matters is not “did AI touch this content” in some abstract sense. Nearly every post touches AI somewhere now, whether that is a grammar check, a scheduling tool, or a caption idea. The distinction that matters is between AI-assisted work, where a human wrote the real substance and used a tool to speed up production, and AI-generated work, where the tool produced the core content itself, especially realistic images, video, or audio of people.

    Skip the disclosure

    Using AI to brainstorm caption ideas you then rewrote yourself. Using AI to resize or color-correct a photo you actually shot. Using AI for grammar and spell checking.

    Disclose clearly

    A fully AI-generated image or video, especially one depicting a realistic person. AI-written copy that ran with no meaningful human edit. A synthetic voiceover standing in for a real person.

    That split lines up with what most consumers actually seem to object to. The trust data is not punishing brands for using a grammar checker. It is punishing brands for letting a fully synthetic image or video pass as authentic without saying so. Framing your policy around this distinction, rather than trying to disclose every single tool touchpoint, keeps you honest without turning every caption into a legal disclaimer.

    How to Disclose Without Undercutting Your Own Content

    Wording matters more than most brands assume. A flat, generic label like “AI-generated content” reads as a compliance stamp and does little to build trust on its own. A specific, human sentence does more work. Something like “we used AI to help draft this caption, then edited it ourselves” tells your audience exactly what happened and signals that a person was still involved and cared about the result.

    1. Be specific about what the tool did.

      “AI-assisted” tells your audience nothing on its own. “AI helped generate the visuals, our team wrote the copy” tells them everything they need.

    2. Put the disclosure where the platform expects it.

      Follow Meta’s in-post tag placement or TikTok’s on-screen label rather than burying a mention deep in the caption, since audiences and moderation systems both read prominent placement as more honest.

    3. Pair disclosure with your strongest creative, not your weakest.

      Since the research shows labels protect engagement when the underlying content is strong, do not save disclosure practice for your lowest-effort posts.

    4. Test the wording itself.Β 

      Treat disclosure language like any other content variable. Run one version against another the same way you would test a hook, following the same one-variable-at-a-time approach covered in our piece onΒ organic content experiments without a budget.

    Delphi, Bluekona AI mascot

    Disclosure isn’t a confession booth. It’s a chance to remind people a real person is still steering the ship, and that’s worth saying out loud.

    Turning Transparency Into a Trust Advantage

    Most of the brands your audience follows are still treating disclosure as a liability to minimize rather than a habit to build. That gap is an opening. A brand that discloses clearly, pairs that disclosure with genuinely strong creative, and keeps a real human voice active in the process is doing something the majority of accounts in any given feed are still avoiding.

    This only works as a long-term habit if you are also watching how your audience actually responds, not just guessing. That is where a realΒ human brandΒ approach and consistent auditing work together. You cannot fix a disclosure policy you are not measuring, and most small teams have no clean way to see whether a labeled post is landing differently than an unlabeled one across YouTube, Instagram, Facebook, and Threads at once.

    Brands that treat AI as one tool inside a broader strategy, rather than the whole strategy, tend toΒ scale with AIΒ without losing the trust that got them followers in the first place. Disclosure is not the enemy of growth. Sloppy, unexamined use of AI is. Get the distinction right, and transparency becomes one more reason your audience sticks around instead of one more reason they scroll past.

  • How to Report Social Media Results to Leadership Without Losing the Room

    How to Report Social Media Results to Leadership Without Losing the Room

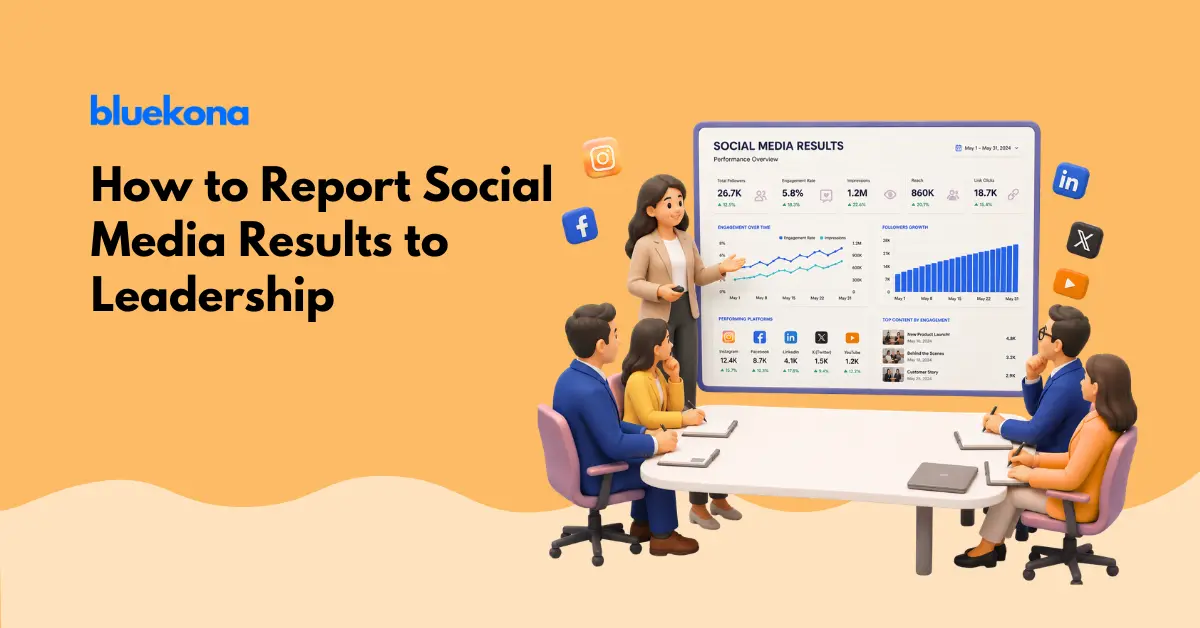
    You spend an hour every month pulling numbers into a slide deck. Reach is up. Engagement is up. Followers are up. Then you present it to your founder or your leadership team, and the room goes quiet in the wrong way. Nobody argues with the numbers. Nobody looks convinced by them either.

    That gap is one of the most common frustrations in marketing right now. 65% of leadership want to see direct connections between social campaigns and business goals, and 52% want quantifiable cost savings across their channels. Your report might be perfectly accurate. It might just be answering questions nobody in that room is actually asking.

    This guide walks through how to build a social media report leadership actually trusts, one that speaks in business outcomes instead of platform metrics, and how tools like Bluekona’s AI powered audits can do most of that translation work for you automatically.

    65%
    of leadership want social campaigns tied directly to business goals
    Verloop, August 2025
    30%
    of marketers believe they can actually measure social media ROI
    Statista, May 2025
    21%
    rise in board pressure on marketing leaders to prove ROI since 2023
    The CMO Survey, Spring 2025

    Why Your Leadership Report Keeps Falling Flat

    Most social media reports fail for a simple reason. They are written by a marketer, for a marketer. Every number on the page makes sense to the person who built the dashboard. Almost none of it maps cleanly onto the questions a founder or a CFO is actually holding in their head walking into that meeting.

    The metrics you track aren’t the metrics they care about

    Reach, impressions, and engagement rate are genuinely useful. They tell you whether your content strategy is working from one week to the next. They tell your leadership almost nothing about whether the marketing budget is paying for itself. When a report opens with platform level metrics, it is speaking a language leadership never agreed to learn. Our piece onΒ the problem with social media metricsΒ goes deeper into why this disconnect exists in the first place, and it is worth reading before you build your next report.

    The attribution gap everyone feels but nobody names

    Nearly every executive believes social media influences revenue somewhere along the funnel. Very few of them can point to the exact number. 97% of leaders believe they can communicate social media’s value internally, yet only 30% of marketers believe they can actually measure social ROI, according to a Statista survey. That gap between belief and proof is the whole problem. Believing something matters is not the same as proving it, and leadership knows the difference even when they cannot articulate it.

    Delphi, Bluekona AI mascot

    Everybody believes social media works. That’s cute. Show me the number or it did not happen.

    What Leadership Actually Wants to Hear

    Leadership is not asking you to abandon social media metrics. They are asking you to translate them. A founder does not need to know your share to reach ratio. They need to know whether the marketing team is moving the business forward, and by roughly how much.

    Business outcomes over vanity metrics

    Followers, likes, and impressions are participation numbers. They describe activity, not impact. Business outcomes such as qualified leads generated, website traffic from social, revenue assisted by social touchpoints, and customers retained through social support are the numbers that connect your work to what leadership actually manages toward. Pressure to make that connection keeps climbing. The CMO Survey found that board level pressure on marketing leaders to prove ROI rose 21% between 2023 and 2025, with pressure from the CFO alone climbing 52% in the same period.

    The three questions every executive is silently asking

    Every leadership report should answer three questions, whether or not leadership says them out loud. Is this working, translated into numbers a P&L would recognize. Is this worth what we are spending on it, compared to other channels. What happens to the business if this budget got cut in half next quarter. If your report cannot answer those three questions on the first page, everything else you present is just supporting detail nobody asked for.

    The Report Structure That Actually Lands

    The single biggest change you can make to a leadership report has nothing to do with which metrics you include. It is the order you present them in.

    Lead with the business question, not the platform breakdown

    Open with the outcome, then support it with the platform data, not the reverse. Start the report with a single sentence such as “social media contributed to 40 qualified leads and an estimated portion of pipeline this quarter,” then use the rest of the page to show your work. Most reports do this backwards, opening with an Instagram summary, then a Facebook summary, then a LinkedIn summary, and only mentioning business impact on the last slide if there is time left. Leadership checks out long before that slide arrives.

    One page, three numbers, one story

    Discipline is the differentiator here. Pick three numbers that matter most this period, not fifteen. Wrap them in a single narrative about what changed and why. A report with three well chosen numbers and a clear story beats a report with thirty numbers and no throughline, every single time.

    The One Page Rule

    If your leadership report cannot fit on one page with room to breathe, you have not finished editing it yet. Cut until the story is obvious, then stop.

    One page. Three numbers. One story. If your report needs its own table of contents, you already lost the room.

    Delphi, Bluekona AI mascot

    Where Bluekona does the translation work for you

    Pulling this structure together manually every month means logging into four different platform dashboards, exporting spreadsheets, and reconciling numbers that were never designed to sit next to each other. This is exactly the gap Bluekona was built to close. AΒ cross-platform social media auditΒ from Bluekona pulls your YouTube, Instagram, Facebook, and Threads data into one place and applies AI generated insights that already speak in outcomes rather than raw platform metrics. Instead of spending an afternoon reconciling numbers, you get a business ready summary you can drop straight into your leadership report, along with the supporting detail if anyone asks for it. You can also see how our guide onΒ scaling social media strategy with AIΒ connects to this same idea of letting automation carry the reporting workload.

    Turning Raw Metrics Into an Executive Narrative

    Once you have your three numbers, the next skill is translation. This is where most reports either win the room or lose it entirely.

    From engagement rate to pipeline signal

    Engagement rate on its own means little to leadership. Reframed as a pipeline signal, it becomes useful. Instead of reporting “engagement rate was 4.2% this month,” report “content that answered a specific customer question generated three times the saves and drove a measurable increase in demo requests.” The number is the same underlying data. The story is what makes it land. Our post onΒ the link between content and conversionΒ breaks down how to make that connection credibly instead of stretching the data further than it can go.

    From reach to brand equity, in plain language

    Reach and impressions are not worthless, they are just misunderstood at the leadership level. Reframe them as brand equity building, the slow accumulation of familiarity and trust that eventually shortens your sales cycle. Say it plainly. “Our reach growth this quarter means more of our target buyers recognize the brand before a sales conversation ever starts.” That sentence does more work in a leadership meeting than any reach chart ever will.

    A Sample Monthly Leadership Report Template

    Here is a simple structure you can adapt starting with your next reporting cycle. It leads with outcomes, keeps supporting metrics visible, and flags status clearly so leadership can scan it in under a minute.

    MetricWhat It Tells LeadershipStatus
    Social assisted revenueDirect dollar contribution from social touchpointsOn Track
    Qualified leads from socialVolume feeding directly into the sales pipelineWatch
    Cost per social acquired customerEfficiency compared to paid alternativesOn Track
    Branded search volumeLong term brand equity buildingAt Risk

    What to include, what to cut

    Include anything that ties back to revenue, pipeline, retention, or brand equity. Cut anything that only measures activity, such as number of posts published or hours spent on content creation. Those numbers matter to you as a manager. They mean nothing to someone deciding whether to fund next quarter’s budget.

    Common Mistakes That Undermine Your Credibility

    A few habits quietly damage trust in your reporting over time, even when the underlying work is strong.

    Strong Report
    • Opens with one clear business outcome
    • Three metrics maximum on the summary page
    • Plain language, no platform jargon
    • Flags risk areas honestly, before leadership asks
    Weak Report
    • Opens with a platform by platform breakdown
    • Fifteen or more metrics with no clear priority
    • Heavy jargon assumed to be self explanatory
    • Only positive numbers shown, risk buried or skipped

    Overloading the room with data

    More data does not build more trust. It usually does the opposite. When leadership sees twenty charts, they assume you are hiding the real story behind volume. A tight report signals confidence. A dense one signals uncertainty, even when the underlying numbers are good.

    Reporting activity instead of outcomes

    Number of posts, number of stories, number of hours spent editing video, these describe effort, not results. Leadership funds results. If your report leans heavily on activity metrics, it reads as an excuse for a missing outcome rather than evidence of one.

    Building a Reporting Cadence Leadership Trusts Over Time

    One good report earns attention. A consistent cadence earns trust. Report on the same three to five outcome metrics every single cycle so leadership can see trendlines, not just snapshots. Flag risk honestly and early, since leadership forgives a missed number far more easily than a surprised one. And keep the format identical every time. Predictability is part of what makes a report feel credible, because leadership starts to recognize the pattern and trust what sits inside it.

    None of this requires a new dashboard built from scratch or a data analyst on staff. It requires a consistent source of truth across every platform you run, translated into language that matches how your leadership actually thinks about the business.

    Delphi, Bluekona AI mascot

    Let Bluekona chew through the platform data so you walk into that meeting looking like the smartest person in it. I will take the credit later.

    If you are rebuilding your reporting process this quarter, start with a single cross platform audit. Seeing your YouTube, Instagram, Facebook, and Threads performance translated into one business ready summary is usually the fastest way to spot which three numbers deserve the spotlight in your very next leadership meeting. OurΒ guide to tracking content performance without a spreadsheetΒ pairs well with this process if you want to go deeper on the mechanics.

  • How Often Should SMBs Actually Post? What 2026 Data Says

    How Often Should SMBs Actually Post? What 2026 Data Says

    Every SMB marketing team has stared at a blank content calendar and asked the same question. How many times a week do we actually need to post? Ask ten agencies and you get ten different numbers. Ask an algorithm update and the number changes again next quarter. The good news is that fresh 2026 data gives a much clearer answer than most advice columns offer, and it has almost nothing to do with hitting a magic number.

    This article breaks down what the newest research says about posting frequency on Instagram, Facebook, and YouTube. It also explains why the “right” number is different for every account, and how to stop guessing and start using your own engagement data instead.

    Why “Post Every Day” Became the Default Advice

    The daily posting rule got popular for an honest reason. Early social algorithms rewarded raw activity, and agencies with big teams that posted constantly grew fast. Smaller teams copied that playbook without asking whether it fit their resources or their audience.

    Most SMB teams don’t have an agency’s headcount. A founder running marketing solo, or a two-person team splitting content across four platforms, doesn’t have the bandwidth to post daily on Instagram, Facebook, and YouTube at once. Following advice built for a fifteen-person social team usually leads to burnout, rushed content, and a feed full of filler posts nobody engages with.

    Delphi, Bluekona AI mascot

    Posting five times a day just to look busy is like a fish swimming in circles. Looks like effort, goes nowhere.

    What the 2026 Data Actually Shows

    Buffer’s 2026 State of Social Media Engagement report analyzed more than 52 million posts across ten platforms, collected between 2024 and 2025. It is one of the largest posting frequency studies available, and its findings are more useful than any single “post X times a week” rule.

    450%
    More engagement per post for accounts posting in 20 or more of 26 weeks
    Buffer, State of Social Media Engagement 2026
    66%
    More subscribers for YouTube channels posting 12 or more times a month
    VidIQ, 2026 channel analysis
    42%
    More engagement on Threads for accounts that reply to comments
    Buffer, State of Social Media Engagement 2026

    Consistency Beats Volume

    The single biggest factor in the Buffer study was not posting frequency. It was consistency over time. Accounts that posted in at least 20 of the 26 weeks measured saw roughly 450 percent more engagement per post than accounts that posted in four weeks or fewer. Accounts that posted somewhere in between, five to nineteen weeks, still saw about 340 percent more engagement than sporadic posters.

    That gap is bigger than the difference between any two specific posting frequencies. A brand that posts three times a week, every single week, will likely outperform a brand that posts daily for two weeks and then disappears for a month. This is exactly the pattern Bluekona’s own research onΒ content velocity versus content qualityΒ points to as well.

    Showing up three times a week, every week, beats showing up daily until you get tired and vanish for a month. Consistency is the actual flex.

    Delphi, Bluekona AI mascot

    Platform by Platform Benchmarks

    Once consistency is locked in, platform benchmarks are a useful starting point for how much to post. Here is what recent research points to for the platforms Bluekona covers.

    PlatformRecommended FrequencyWhat the Data ShowsImpact
    Instagram3 to 5 feed posts weekly, plus 2 to 4 ReelsIn-feed posts perform best around 3 to 5 times weekly, while Reels need higher frequency to sustain reachHigh Impact
    Facebook1 to 2 posts per dayA HubSpot study of over 13,500 Facebook users found this frequency performs bestModerate
    YouTube Shorts3 to 5 Shorts weeklyChannels posting 12 or more times monthly gain 66 percent more subscribersHigh Impact

    Where the Returns Start Shrinking

    Buffer’s data also shows a real ceiling. Moving from one post a week to two to five posts a week produces a strong lift in views per post. Posting six to ten times a week adds more gains, but each additional post adds less than the one before it. Beyond that point, reach per individual post tends to decline even as total account activity climbs.

    In plain terms, more posts grow an account’s total reach, but each post reaches a shrinking slice of the audience. That tradeoff works fine for teams with the capacity to sustain it. It becomes a losing trade the moment it means every post gets less thought than the last one, a pattern covered in more depth in the problem with social media metrics.

    Quick Takeaway

    More posts grow total reach. Fewer, stronger posts grow reach per post. Pick the tradeoff that fits your team’s actual capacity, not the one that sounds most impressive in a meeting.

    Why the Right Number Is Different for Every Account

    Platform benchmarks are averages pulled from millions of accounts across every industry imaginable. Your account is not average. A dental practice’s audience checks Instagram differently than a beverage brand’s audience does. A B2B founder’s LinkedIn habits look nothing like a consumer brand’s Facebook habits.

    The benchmarks in this article are a reasonable starting point if you have no other information. But the moment you have a few weeks of your own posting history, your own numbers should carry more weight than any industry study, including this one.

    Works Well

    Posting Based on Your Own Data

    You track which formats and days actually drive engagement, then adjust your plan to match your audience.

    Falls Short

    Posting Based on a Generic Rule

    You copy a frequency number from a blog post or competitor and apply it regardless of your own audience behavior.

    How to Find Your Own Optimal Cadence

    Figuring this out manually means exporting data from several analytics dashboards, lining it up in a spreadsheet, and hoping a pattern appears before the quarter ends. Most SMB teams don’t have the hours for that, so they default to a generic number and hope for the best. This is the exact gap explored inΒ tracking content performance across platforms without a spreadsheet or analyst.

    A cross-platform audit handles that comparison automatically. Instead of guessing whether Tuesday or Thursday works better for Instagram Reels, or whether a Facebook page is quietly overposting, you get a direct read on which days, formats, and frequencies are driving real engagement and leads on your specific accounts. UnderstandingΒ how dwell time quietly controls reachΒ also helps explain why some high-frequency accounts still underperform lower-frequency ones.

    A Realistic Weekly Posting Plan for Lean Teams

    For a founder or small team managing Instagram, Facebook, and YouTube without a dedicated analyst, a sustainable starting cadence looks like this. Three feed posts and two to three Reels on Instagram each week. Five posts a week on Facebook, spaced out rather than batched into a single day. Two to three YouTube Shorts a week, treated as a discovery tool for new viewers rather than an update reserved for existing subscribers.

    None of those numbers are fixed rules. They are a starting point to test for four to six weeks, then adjust once real engagement data shows what is actually working, an approach covered in detail in balancing content velocity and quality in the AI era.

    Batching production and batching publishing are two different things, and mixing them up is where a lot of lean teams burn out. Sitting down once a week to film and write several pieces of content is efficient. Publishing all of them on the same day is not, since it spreads a week’s worth of effort across a single 24-hour window instead of letting each post earn its own attention. Spacing scheduled posts across the week, even when they were all created in one sitting, tends to protect reach without adding any extra production time.

    Frequently Asked Questions

    Is it possible to post too often?

    Yes. Data shows reach per post can decline past a certain frequency, and audiences tend to tune out repetitive or overly promotional content. More posts should never come at the cost of quality.

    What happens if a team misses a week?

    One missed week will not undo months of consistent posting, but repeated gaps hurt more than most teams expect. The 2026 data shows accounts posting in fewer than a third of the weeks studied saw dramatically lower engagement than consistent posters.

    Should every platform get the same posting frequency?

    No. Facebook, Instagram, and YouTube reward different cadences and formats, which is exactly why platform-specific and account-specific data matters more than a single blanket number pulled from a general study.

    How long does it take to see whether a new cadence is working?

    Most accounts need four to six weeks of consistent posting before a new cadence produces a reliable read. Shorter test windows tend to get thrown off by a single viral post or a slow news week, so patience matters as much as the plan itself.

  • Social Media A/B Testing Without a Budget: How to Run Organic Content Experiments That Actually Teach You Something

    Social Media A/B Testing Without a Budget: How to Run Organic Content Experiments That Actually Teach You Something

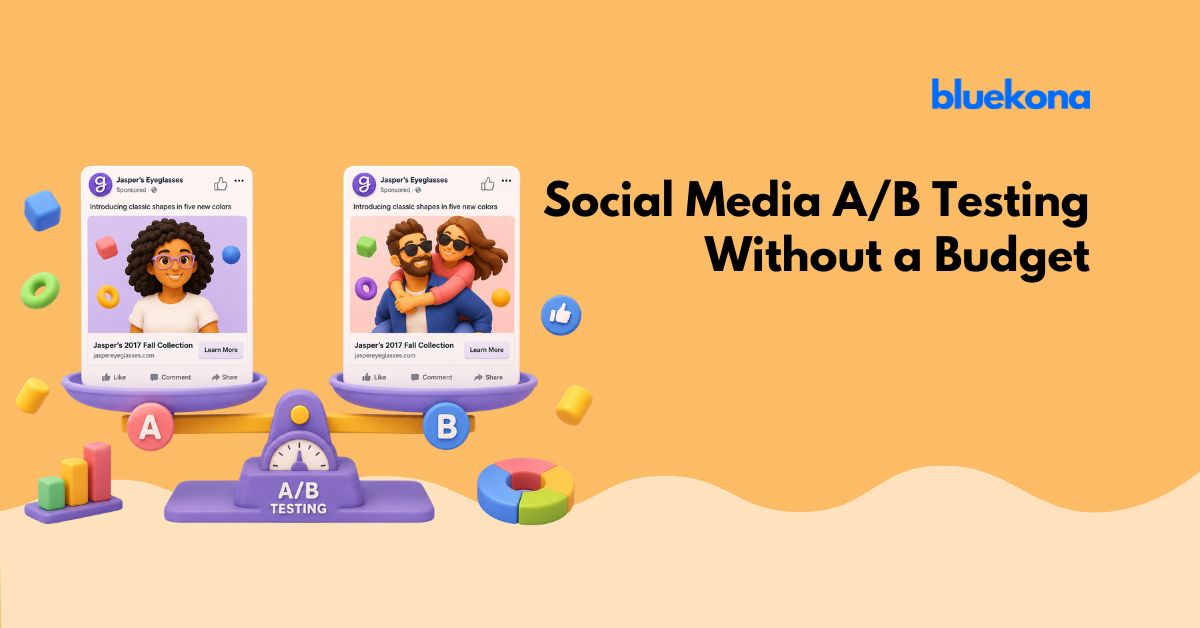
    Most teams assume A/B testing belongs in the paid ads world. And honestly, that assumption makes sense. Paid gives you a clean split. Two versions, two audience groups, one clear winner. Organic social does not work that way. You cannot divide your audience. You cannot post two versions at the same time and measure them side by side.

    So most content teams skip experiments entirely and go with gut feel instead.

    That is where growth stalls.

    You do not need a paid budget to run meaningful content experiments. You need a system. And right now, most of your competitors are running without one. They post, check the numbers, feel okay or a little disappointed, and move on. No written hypothesis. No experiment log. Nothing changes next time because of what happened last time.

    This guide walks you through a practical framework for running organic social media A/B tests that give you real, repeatable lessons. Not hunches. Actual insights that compound into a content advantage over time.

    Why Most Organic Teams Never Actually Learn

    The irony of social media is that you are already swimming in data. Every platform gives you reach, impressions, saves, shares, watch time, and click-through rate. You are not short on numbers.

    What most teams are short on is a structure for turning those numbers into conclusions.

    When you post a video, check the views, notice it did well, and try to “do more of that” next week without understanding what specifically worked, you are not learning. You are hoping the same unknowable combination of factors lines up again on its own.

    Real learning needs a before-and-after comparison where only one thing changed. Without that, every result is ambiguous. Your Reel got 80% more reach this week. Was it the hook? The format? The audio? The fact that you posted on a Wednesday instead of Monday? The algorithm having a generous day?

    You will never know. And that is the whole problem. Check out our article on the problem with social media metrics to understand why this blind spot costs most teams more than they realise.

    The One Rule That Makes or Breaks Every Experiment

    Change exactly one thing at a time.

    That is the whole rule. Everything else in your testing process builds on this single idea.

    If you change your hook, your format, your posting time, and your caption length all in the same post, and that post performs well, you have a data point but no lesson. You cannot untangle what drove the result. You are right back to guessing.

    The discipline of organic A/B testing is picking one variable, keeping everything else the same, and comparing the results over a consistent time window. It feels slow. It is the only method that actually tells you what is working and why.

    Delphi, Bluekona AI mascot

    Changing your hook, your format, your caption length and your posting time in the same test is not an experiment. That is just chaos with a content calendar.

    What to Test First (and What to Leave for Later)

    Not all variables are worth your time equally. Some have a massive impact on whether your content gets seen at all. Others are marginal adjustments. Here is where to focus first, and what to come back to once you have the big stuff dialled in.

    Start Here

    Hook or Opening Line

    The first sentence of your caption, the first frame of your video, or the headline on a static post. This is the highest-leverage variable across almost every platform. A weak hook kills reach before the algorithm has a chance to push the content anywhere.

    Start Here

    Content Format

    Carousel versus single image versus Reel versus text post. Format sends a major signal to platform algorithms and shapes how your audience consumes and shares content. Test the same topic in different formats to isolate what the format itself is contributing to your results.

    Next

    Call to Action Wording

    The specific words and placement of your CTA drive comments, saves, and shares, which all feed the algorithm. Small wording changes produce surprisingly large differences. Test “Save this for later” against “Which tip was most useful to you?” and you will likely see a real gap.

    Next

    Posting Time and Day

    When your audience is online and in what mindset matters more than most people think. Test the same content type at different times to find your actual peak windows, not the generic “best times to post” guides that have nothing to do with your specific audience.

    Later

    Caption Length

    Short and punchy versus long-form and contextual. Platform and audience both shape which performs better. The only way to know what your specific audience prefers is to test it directly on your own account, not by following generic platform advice.

    Later

    Thumbnail or Cover Image

    On YouTube and TikTok especially, the cover frame or thumbnail determines whether anyone clicks or watches in the first place. If video is your primary format, move this variable higher on your testing list. It is one of the most direct levers for improving click-through rate.

    How to Run the Experiment Step by Step

    Here is the process that separates teams who accumulate real content knowledge from teams who are still guessing after two years of posting.

    • 1
      Write a hypothesis before you post anything. Do not reverse-engineer a story after the results come in. Write it down first. Something like “I believe a question-based hook will generate more comments than a statement hook on our LinkedIn posts about analytics, because it prompts the reader to give a direct response.” This forces clarity and makes your results actually interpretable.
    • 2
      Create two versions of the post and change only one variable. Write Version A and Version B. Keep the topic, format, visual style, posting time, and hashtags identical. The only thing that changes is your test variable. If you are testing hooks, the rest of the caption must stay exactly the same in both versions.
    • 3
      Post them in the same week on different days. Post Version A on Tuesday, then Version B on the following Tuesday. Same time of day, same platform, same week of the month. You cannot post both simultaneously on organic, so this staggered approach is your best approximation of a controlled comparison.
    • 4
      Measure the right metric for the variable you are testing. Match your measurement to your test. Testing a CTA? Measure comments and saves. Testing a hook? Measure early reach and the percentage of people who watched past the first three seconds. Testing format? Look at shares and profile visits. Using one vanity metric for everything will give you misleading conclusions.
    • 5
      Log the result as a win, a loss, or inconclusive. Keep a simple experiment log. Record what you tested, the hypothesis, the result for each version, and your conclusion. A basic spreadsheet works. The log is the real asset here. It is what turns a collection of individual tests into compounding institutional knowledge about your audience.
    • 6
      Run the same test at least three times before drawing conclusions. One test is a data point. Three tests are a pattern. If question-based hooks outperform statement hooks in three out of three tests, you have a finding worth acting on. If results split two to one, keep testing. Do not build strategy on a single result.

    Which Metrics to Track on Each Platform

    One of the most common testing mistakes is measuring the wrong thing. A post can have high reach and zero engagement. Another can have low reach and very high saves. Which one won? It depends entirely on what you were testing for.

    Match your measurement to your variable every single time. Here is a quick breakdown of which metrics signal real performance on each platform, as opposed to the vanity numbers that look good but tell you nothing useful.

    On Instagram, saves and shares carry the most algorithmic weight. Reach from people who do not follow you yet is a signal that the algorithm is actively pushing your content beyond your existing base. Likes are the weakest indicator by far and should be the last thing you optimise for.

    On LinkedIn, comments and reposts are what drive reach. Impressions from outside your network tell you the content is breaking through into new audiences. Reactions matter far less than the volume and quality of comments you generate. See our breakdown of LinkedIn content strategy for more context on what the algorithm rewards.

    On TikTok, watch time percentage and rewatch rate are the metrics that matter most. A high view count with low average watch time means people are clicking away fast. That is a negative signal regardless of how impressive the raw number looks in your dashboard.

    On YouTube, click-through rate on your thumbnail and title combined with average view duration explains most of your algorithmic performance. High CTR with low view duration is a signal your title over-promised what the video actually delivered.

    On Facebook, shares and link clicks matter most for organic reach. Track your organic reach per post as a percentage of your total follower count. If that ratio is shrinking month over month, your content is losing relevance with the algorithm. Our guide on Facebook metrics that actually matter in 2026 goes deeper on this.

    On Threads, replies and quote posts are the strongest signals. Reshares tell you people found the content worth amplifying to their own networks. Like counts on Threads are almost meaningless as a performance indicator and should be ignored when evaluating your tests. And if you want to understand how dwell time quietly shapes your reach, that applies across all of these platforms too.

    Likes are the participation trophy of social media. Nice to receive. They will not tell you a single useful thing about whether your content is actually working.

    Delphi, Bluekona AI mascot

    Building a Quarterly Learning Loop

    Individual tests are useful. A system of tests over time is a growth engine.

    The difference is compounding. Each experiment builds on the last. After a quarter of structured testing, you stop asking “what should we post this week?” and start asking “based on what we already know works, what should we test next?” That shift changes how your whole content operation runs.

    Here is a simple quarterly loop that works for SMBs and agencies of any size.

    In Month 1, run four to six hook experiments on your two most active platforms. By the end of the month you should know with real confidence which hook styles drive the most early engagement for your specific audience, not for someone else’s audience in a different niche.

    In Month 2, run four to six format experiments, applying your winning hook style from Month 1. You are now stacking knowledge. You have already optimised the opening line. Now you are testing what structure and format perform best on top of that foundation. See our piece on why manual audits waste your time for how automation can accelerate this part of the process.

    In Month 3, test CTA wording and posting time. By this point your content is already stronger from two rounds of experiments. The smaller optimisations compound on a better base and produce a bigger result than they would have at the start.

    At the end of the quarter, review your experiment log and write a short summary of what you found. This becomes your actual content strategy for the next quarter. Not a mood board. Not a trend report. An evidence-based plan built entirely on what you know works for your audience.

    Mistakes That Make Your Tests Useless

    Testing too many variables at once. Already mentioned, worth repeating one more time. One variable per test. Every single time. No exceptions.

    Pulling results too early. Organic content needs time to distribute and find its audience. Do not compare a two-day-old post to a seven-day-old post. Set a consistent measurement window of five to seven days and apply it to every experiment you run, every time.

    Treating outliers as strategy. A post that goes semi-viral will skew your data. Note it in your log, celebrate it, and then set it aside when drawing conclusions. Do not rebuild your entire content approach around one anomaly that you may never be able to replicate.

    Missing the external context. A post that underperforms during a major news cycle or platform outage is not failing because of your content. Log what was happening alongside your results. That context becomes important when you review your data later and need to explain why a particular test week looks different from the rest.

    Comparing across different audience sizes. If your account grew significantly between Version A and Version B, you are not running a fair comparison. You are measuring two different audience pools. Flag large growth jumps in your experiment log and treat those results with appropriate caution.

    The Compounding Advantage

    Most of your competitors are not doing this.

    They are posting based on what worked for someone else, in a different niche, with a different audience, six months ago. They are copying trending formats without checking whether those formats actually convert for their specific followers. And when something underperforms, they shrug and move on without a single lesson to show for it.

    When you have six months of structured organic experiments behind you, you have something no competitor can copy. Tested, validated knowledge about what works for your audience, on your platforms, in your category. Because every experiment builds on the last, the knowledge gap between you and teams that are still guessing keeps getting wider every single week.

    The brands that win on organic social over the long term are not always the ones with the biggest teams or the most creative instincts. They are the ones who learn faster. Structured A/B testing on organic content is exactly how you build that learning advantage, without spending a cent on ads. If you want to see how this applies to a specific brand playbook, our breakdown of scaling social media strategy with AI is a good place to go next.

    Delphi, Bluekona AI mascot

    Your competitors are still posting on vibes. You are posting on evidence. That is not a small edge. That is the whole game.

    Bluekona AI gives you cross-platform analytics, automated content audits, and actionable insights across every platform in one place, so your experiment log practically writes itself.

  • Social Commerce: How to Turn Followers into Buyers Without Paid Ads

    Social Commerce: How to Turn Followers into Buyers Without Paid Ads

    Social commerce is now a $2.6 trillion global market. And a big chunk of that money is moving through organic content, not paid ads.

    That might surprise you. We have spent years being told that if you want to sell on social media, you need to pay to play. Boost posts. Run retargeting campaigns. Spend money to make money.

    But something shifted. People started trusting ads less and trusting people more. Real customers showing off real products in their real lives started converting better than any polished campaign. And the platforms themselves built tools that let buyers complete a purchase without ever leaving the app.

    In 2026, the most effective social commerce strategies do not always come with an ad invoice attached. This guide walks you through exactly how to build one.

    What Social Commerce Actually Means?

    Social commerce is not just a “Shop Now” button on a post.

    It has grown into a full buying experience that lives inside social platforms. We are talking about product tags in Reels, live shopping streams on Instagram and YouTube, DM-based checkout conversations, shoppable Stories, pinned posts with direct purchase links, and community spaces where people ask for product recommendations and get them within minutes.

    In 2026, the line between scrolling and shopping is nearly invisible. Consumers are not jumping out of Instagram to visit your website. They are discovering, researching, and buying without ever leaving the app. Instagram’s native search function now processes an estimated 1.2 billion product-related queries every single month. People are using social platforms the way they used to use Google Shopping.

    This is a massive opportunity for brands willing to show up consistently and build real trust before asking for the sale.

    Delphi, Bluekona AI mascot

    The ocean does not advertise itself and yet everything comes to it. Be the ocean. Or at least, be the brand that acts like one.

    The Organic Path from Follower to Buyer

    Think of organic social commerce as a three-stage journey.

    Stage 1 is Awareness. This is where someone discovers you for the first time. Short-form video is king here. A Reel, a YouTube Short, a TikTok that catches someone mid-scroll and makes them stop. They do not know you yet. They are just curious.

    Stage 2 is Consideration. Now they are checking you out. They visit your profile, scroll your feed, watch a few more videos, maybe read some comments. This is where carousels, how-to posts, tutorials, and customer stories do the heavy lifting. You are answering the question “can I trust this brand?”

    Stage 3 is Conversion. This is where a DM, a pinned post, a testimonial video, or a live shopping session tips them over the edge. They are ready to buy. Your job is to make it easy.

    Most brands invest everything in Stage 1 and forget Stages 2 and 3 even exist. That is where followers pile up and sales do not.

    Platform by Platform β€” Where to Focus Your Organic Effort

    Not every platform works the same way for social commerce. Different platforms attract different buyers, support different content formats, and convert at different points in the purchase journey.

    Platform Best For Top Organic Format Native Commerce Feature Conversion Stage
    Instagram Discovery + impulse buying Reels, Carousels, Stories Instagram Shop, product tags, link stickers Awareness + Conversion
    TikTok Viral discovery, Gen Z audience Short-form video, live streams TikTok Shop, live shopping, product showcase Awareness + Conversion
    YouTube Deep trust, high-value purchases Long-form reviews, tutorials, Shorts Shopping shelf, product links in description Consideration + Conversion
    Facebook Community-led selling, 35+ audience Groups, live video, Marketplace listings Facebook Shop, Marketplace, group buy features Consideration + Conversion
    Threads Conversational selling, brand voice Text posts, authentic commentary No native commerce yet β€” bio link driven Awareness (Early)

    The short version: Instagram and TikTok are your best bets for discovery and impulse buying. YouTube builds the deep trust that leads to considered purchases. Facebook still converts well for community-driven sales and slightly older audiences. Threads is early but worth testing for direct, conversational selling that feels genuinely unfiltered.

    The Content Types That Actually Drive Purchase Intent

    Not all content is created equal when it comes to selling. Here are the formats that consistently move people from “interested” to “I want this.”

    User-generated content is the single most powerful purchase driver on social right now. A real customer showing your product in their actual life beats any polished brand video. 74% of shoppers convert from UGC in 2026. Repost it, highlight it, celebrate it. Make your customers feel like stars and they will keep making content for you.

    Tutorials and how-to content work because they answer the question “but will it actually work for me?” When someone watches a video of your product solving their exact problem, the sale is basically already made.

    Before and after posts are simple and effective. Show the transformation. Let the result do the talking. This format works especially well in beauty, fitness, home, and food.

    Founder-led content builds trust faster than almost anything else. When the person behind the brand shows up authentically, people feel like they know you. And people buy from people they feel they know.

    Live shopping streams are growing fast across every platform. They combine entertainment, urgency, and direct purchase in one place. Brands that do live shopping well are seeing conversion rates that paid ads can only dream about.

    Testimonials in video format hit differently than a star rating. Put a real person on camera talking about why they love what you make and watch what happens.

    Why Most Brands Lose Buyers Before the Sale

    You can have great content and still miss the sale. Here are the most common places brands lose buyers mid-funnel.

    No clear next step. You made someone interested and then gave them nothing to do with that interest. Every post designed to convert needs one clear, simple action. Not five options. One.

    A confusing bio link setup. Your bio link is prime real estate. If someone has to click three times to find the product they just saw in your Reel, you have lost them. One fast, frictionless link to exactly what you are showing is what works.

    Inconsistent posting. Trust is built through repetition. If someone discovers you on Monday and your last post was six weeks ago, they move on. Consistency signals you are an active, real business worth buying from.

    Ignoring DMs. A huge amount of social commerce happens through direct messages. Someone asks “do you ship to Canada?” and gets no reply for three days. Sale gone. Treat your DMs like a live checkout counter.

    Skipping the follow-up. Someone saved your post. Someone clicked your bio link but did not buy. Someone DM’d you and then went quiet. A gentle follow-up through Stories, a reply, or a DM check-in often closes the sale that almost happened.

    How to Use Analytics to Find Content That Is Already Driving Sales

    Here is something most brands overlook completely. You probably already have content that is generating real purchase intent right now. You just cannot see it because you are looking at likes and impressions instead of the signals that actually matter.

    The metrics that tell you a post is close to driving a sale are profile visits after a post goes live, bio link clicks, DM volume following specific content, saves and shares rather than just likes, and story link taps.

    When a post causes a spike in profile visits and bio link clicks in the same 24-hour window, that is a buying signal. That person wanted to know more. They were considering a purchase.

    When you can see which content formats, topics, and posting times generate these signals consistently, you stop guessing and start scaling what works. Brands that optimized their Instagram content based on these signals reported a 47% increase in organic product page visits compared to brands that did not.

    This kind of clarity is exactly what a proper social media audit surfaces. Not vanity metrics. The real content behaviors that connect to actual sales.

    Delphi, Bluekona AI mascot

    Likes are applause. Link clicks are people reaching for their wallets. Know the difference. Track the difference. Act on the difference.

    Real Brands Getting Organic Social Commerce Right

    Glossier built a $1.8 billion brand almost entirely on community and user-generated content. Their Instagram still looks more like a fan account than a corporate brand page, and that is entirely the point. Real people, real skin, real results. Their #maskforce campaign invited actual customers to share photos wearing their products, turning every buyer into a brand ambassador. Followers trusted Glossier because Glossier always looked and felt like one of them.

    Rhode Skin (Hailey Bieber’s brand) grew through organic content during its early phase. Minimal editing, founder-led videos, authentic storytelling. The product sold itself because the content made people feel like they were in on something real. Rhode went from launch to billion-dollar valuation with a strategy rooted in genuine community building rather than paid promotion.

    Gymshark is a masterclass in community-first selling. They did not start by selling workout gear. They started by selling a sense of belonging to people who took fitness seriously. Their organic content created a movement, and that movement converted buyers at a scale most brands only achieve through heavy ad spend.

    The common thread across all three? Trust came before the transaction. Their followers felt like fans before they became customers. And fans convert at a completely different rate than cold ad traffic.

    Where Bluekona Fits Into Your Social Commerce Strategy

    Running a full content audit across multiple platforms is genuinely painful if you are doing it manually. You are switching between dashboards, downloading data, and trying to connect dots that live in five different places. Most brands either skip the audit entirely or do it once a year when it is already too late to act on what they find.

    Bluekona pulls all of that together in minutes. You connect your accounts, and you immediately get a clear picture of which content is driving real engagement, which formats your specific audience responds to, and which posts are generating the signals that lead to purchases.

    For social commerce specifically, this means you can find your best-performing content fast, understand what is making people take action, spot the gaps in your funnel before they cost you more sales, and build a content strategy based on your actual data rather than assumptions.

    You do not need to post more. You need to post smarter. Bluekona shows you what smarter looks like for your audience.

    Delphi, Bluekona AI mascot

    I navigate the entire ocean by reading the currents. You have got the data. Use it. Stop swimming in circles.

    Start Turning Followers into Buyers This Week

    Organic social commerce is not a secret hack or a shortcut. It is what happens when you show up consistently with content that builds trust, answers real questions, and makes buying feel like a natural next step rather than a hard sell.

    You do not need a big ad budget to make it work. You need clarity on what your audience actually responds to, a content rhythm that moves people through the funnel, and the right tools to tell you what is working and what is not.

    Run a free Bluekona audit to see which of your posts are already driving purchase intent and what is holding the rest back. Your buyers are already following you. Let us help you bring them the rest of the way.

  • Stop Spying, Start Learning: A Better Way to Use Meta Ad Library

    Stop Spying, Start Learning: A Better Way to Use Meta Ad Library

    Here’s what usually happens. A marketer opens Meta Ad Library, searches a competitor, finds an ad that looks polished, screenshots it, and tries to rebuild it with their own logo. Then they wonder why the results don’t match.

    The problem isn’t the tool. The problem is the approach. Competitor research was never supposed to be a shortcut to creative work. It’s meant to help you understand the market, not replace thinking about your audience.

    The goal of looking at competitor ads isn’t replication. It’s understanding. And those are very different things.

    Copying a competitor’s ad is like wearing someone else’s outfit to a first date. Sure, it might look good on them. But it’s not you, and your audience can tell.

    Delphi, Bluekona AI mascot

    What Is the Meta Ad Library

    Meta Ad Library is a free, publicly accessible database of ads running across Facebook, Instagram, Messenger, and Threads. No account needed. You can search any brand name or keyword and immediately see what ads are currently live.

    It was originally built for ad transparency, but it has quietly become one of the most useful market research tools available to anyone running paid or organic social media. You can view ad creatives, read the copy, see how long an ad has been running, and in some cases check regional targeting details.

    What you cannot see is performance data. No click-through rates. No conversion numbers. No engagement metrics. Just the ad itself, which means interpretation is entirely on you.

    What Competitor Ads Actually Reveal

    When you stop looking for ads to copy and start looking for patterns to learn from, the Meta Ad Library becomes genuinely useful. Here’s what’s actually in there if you look at it the right way.

    01
    Market Positioning
    How brands in your space describe themselves and what they want to be known for. The words they keep using tell you a lot about how the category talks about itself.
    02
    Customer Pain Points
    The problems brands keep returning to, because those are the ones their customers care about most. Repetition across multiple brands signals a real, shared frustration.
    03
    Common Offers
    What incentives dominate the category, from free trials to percentage discounts to lead magnets. Seeing the same offer everywhere tells you what the market expects.
    04
    Content Trends
    Whether the market is leaning into UGC, founder video, carousels, or static image ads right now. Format trends move fast and competitor research catches them early.
    05
    Seasonal Priorities
    What brands push at different times of year and where the gaps in the calendar tend to appear. Knowing the rhythm helps you plan ahead instead of reacting.
    💡
    Keep in mind
    Patterns beat individual ads every time
    None of this tells you what will work for your audience. But it tells you what the market conversation looks like right now, which is valuable context before you make any creative decisions.

    A Practical Meta Ad Library Research Process

    If you want to use the tool well, slow down and be systematic about it. A few searches and screenshots won’t teach you much. Pattern recognition takes a little more time.

    1. Search your direct competitors

    Look at what’s actively running, what themes appear more than once, and whether their messaging feels consistent or scattered.

    2. Search by industry keywords

    Try terms like “fitness coaching” or “accounting software” instead of just brand names. This shows you broader market trends beyond your direct competition.

    3. Look for patterns, not individual ads

    Ask yourself which problems appear repeatedly, which offers everyone is pushing, what emotional angles come up most often, and what formats are everywhere right now.

    One ad is a creative choice. Ten ads with the same hook are market data. That’s what you’re actually looking for.

    Delphi, Bluekona AI mascot

    What To Analyze Beyond the Ad Itself

    Most marketers only look at the creative. But there’s more information available if you’re willing to dig one layer deeper.

    Ad longevity matters a lot. If a brand has been running the same ad for six months, that’s usually a signal it’s performing well. Profitable ads don’t get turned off. So when you see something that’s been live for a long time, that’s not laziness, that’s a strong indicator of a proven message.

    Creative format tells you something too. Is the market full of polished product videos? Founder-led talking head clips? UGC-style testimonials? The format that dominates often reflects what the audience in that category is most comfortable with, which is useful to know before you decide what to make.

    Don’t forget to check the landing page. A lot of the real insight comes after the click. What’s the headline promising? What’s the CTA asking for? Is there a clear offer or just a brand story? The full funnel picture is often more revealing than the ad creative alone.

    If you see a brand running five or six variations of the same ad with slightly different headlines or visuals, that tells you they’re actively testing. Which means they haven’t figured it out yet either.

    The Limitation Most Marketers Ignore

    Here’s what Meta Ad Library actually shows you, and what it doesn’t.

    Shows What Meta Ad Library tells you
    What competitors are publishing
    How long an ad has been running
    Creative formats in use
    Copy and messaging angles
    Does not show What it leaves out
    Audience preferences
    Engagement quality
    Brand perception
    Community response
    What actually converts

    This creates a dangerous assumption that a lot of marketers fall into without realizing it. If a competitor is running an ad, it must be working. Not necessarily. They might be testing something new. They might be burning budget on a campaign that isn’t converting. You have no way to know.

    You can see what they’re saying. You can’t see if anyone’s actually listening. That’s a pretty important gap.

    Delphi, Bluekona AI mascot

    Why Competitor Research Alone Creates Bad Strategy

    When everyone in a category is watching everyone else and copying what looks successful, something predictable happens. Everything starts to look the same. The same hooks. The same offers. The same creative formats. The same emotional triggers.

    This is how markets get saturated with generic content that nobody actually connects with. Everyone is optimizing toward the average, which means nobody is standing out.

    If your entire strategy is built on watching what competitors are doing, you will always be one step behind and you will never say anything that feels original to your audience. You end up competing on execution in a space where everyone is executing the same playbook.

    Competitor research shows you what the market is already saying. It doesn’t tell you what your audience actually wants to hear. That requires a different kind of intelligence altogether.

    Competitor Intelligence vs Audience Intelligence

    These two things solve different problems, and understanding that distinction is what separates brands that are just keeping up with the market from brands that are actually building something.

    Competitor Intelligence answers
    What is the market saying right now
    Which offers are common in the category
    What creative formats are popular
    Where the obvious gaps in positioning are
    Audience Intelligence answers
    What your specific audience actually cares about
    Which content drives real engagement
    What topics consistently build trust
    What sparks conversation and builds community

    Both are valuable. The problem is when brands treat the first as a substitute for the second. Knowing what the market is saying is only useful if you also know what your audience is listening for.

    Where Bluekona Fits Into This

    Meta Ad Library tells you what’s happening in the market. Bluekona tells you what’s happening with your audience. And that second part is where most of the real decisions actually get made.

    Bluekona helps you understand which topics your audience engages with, what content consistently performs across your channels, and which themes are building genuine interest over time rather than just getting seen once and forgotten.

    When you’re looking at engagement patterns, you start to see things that competitor research can never show you. What drives people to comment. What gets shared. What kind of content makes someone stop scrolling long enough to actually read something. What builds a community rather than just an audience.

    This is also where you can validate ideas before spending real budget on them. Competitor research might surface an idea worth exploring. Bluekona helps you figure out whether that idea actually resonates with your people before you invest in building it out.

    The Best Competitive Research Workflow

    The most effective approach isn’t choosing one over the other. It’s being clear about what each one is actually for and using them together as a full picture rather than treating either as the whole answer.

    Step 1
    Use Meta Ad Library to understand
    Market trends
    How competitors are positioning themselves
    What offers are common in your category
    Which creative formats are dominating right now
    Step 2
    Use Bluekona to understand
    Your audience’s actual interests
    Which content themes perform best for you specifically
    Engagement patterns that show what builds real community
    Whether ideas from market research will land with your people

    Together they give you something that neither can offer on its own: a clear picture of what the market is doing and a clear picture of whether any of it applies to you. That combination is where smarter marketing decisions come from.

    The brands that win aren’t the ones with the best eye for copying. They’re the ones who learn from the market and build around their audience. Market intelligence tells you where the opportunities are. Audience intelligence tells you which ones are actually worth pursuing.

    Frequently Asked Questions

    Is the Meta Ad Library free to use?

    Yes. Anyone can access it without creating a Meta account. Just go to the library, search a brand name or keyword, and the active ads will show up.

    Can I see competitor Facebook and Instagram ads?

    Yes. The Meta Ad Library shows active ads from any brand running campaigns across Facebook, Instagram, Messenger, and Threads.

    Does Meta Ad Library show ad performance?

    No. It does not provide engagement data, click-through rates, or conversion information. You can see the ad creative and how long it has been running, but not how it is actually performing.

    Should I copy competitor ads?

    No. Use competitor ads to understand market trends and patterns. Copying creative directly puts you in a reactive position and tells you nothing about whether it will work for your specific audience.

    How does Bluekona complement Meta Ad Library research?

    Meta Ad Library gives you market intelligence, showing you what competitors are publishing and what patterns exist across the category. Bluekona gives you audience intelligence, showing you what your specific community engages with, what content performs, and which ideas are worth pursuing before you put budget behind them.

    Don’t stop at competitor research

    Understanding what the market is doing is a starting point, not a strategy. Find out what your audience actually cares about and build from there.

  • Why the Same Social Media Strategy Fails Across Platforms

    Why the Same Social Media Strategy Fails Across Platforms

    Most brands do not actually have a content problem. What they have is a mismatch problem. The same post goes out on LinkedIn, Instagram, TikTok, Facebook and YouTube, all on the same day, all looking the same. Then everyone sits around wondering why one platform brings results and the rest bring silence.

    Here is the simple truth. Different people use different platforms for different reasons. A teenager scrolling TikTok on a Tuesday night is not in the same headspace as a manager researching software on YouTube during lunch. A founder checking LinkedIn before a meeting is not doing the same thing as a parent chatting in a Facebook group about weekend plans.

    This guide walks through how audience, platform, content and business goals fit together, and how Bluekona helps you figure out what is actually working instead of guessing.

    The Biggest Social Media Mistake Brands Still Make

    A lot of companies treat social media like a broadcast tower. One piece of content goes up, then it gets copied and pasted across five platforms with zero changes. Same caption, same image, same tone, everywhere.

    The problem is that social platforms are not the same kind of place. They are not five doors leading into the same room. Each one is its own little world, with its own rules, its own pace and its own kind of audience attention. When you post the exact same thing everywhere, you are speaking the same language to people who are not listening for the same things.

    Think about how differently you behave on different apps. On LinkedIn you might be reading something useful before a meeting. On Instagram you might be looking for something nice to look at while waiting in line. On TikTok you might just want to laugh for thirty seconds. None of these moods match up, so why would one piece of content work for all of them?

    Different Platforms, Different Mindsets

    People do not just use platforms, they use them with a purpose in mind, even if that purpose is something small like killing five minutes. Once you understand what mindset someone is in when they open an app, it becomes much easier to know what kind of content will actually land.

    LinkedIn

    On LinkedIn, people are usually thinking about their work, their career or their industry. They are reading with a slightly more serious hat on. This is the place for thought leadership, industry insights, case studies and the occasional opinion that goes against the usual advice. People here want to learn something or feel sharper after reading.

    Instagram

    Instagram is more about feeling than thinking. People come here for inspiration, for lifestyle, for a sense of who they want to be. Reels, visual storytelling, behind the scenes glimpses and creator collaborations all do well here because they tap into identity and aspiration rather than logic.

    TikTok

    TikTok is built for discovery and entertainment. People are not searching for anything specific, they are just scrolling and letting the app surprise them. Short videos, trends, things that feel real and unpolished, and quick product demos all fit this fast moving environment.

    Facebook

    Facebook still has a strong sense of community and family around it. A lot of activity happens in groups, in local discussions and around small businesses. Customer stories and community conversations do well here because people are looking for connection, not just content.

    YouTube

    YouTube is where people go when they actually want to solve something. They are researching, learning or trying to decide between two options. Tutorials, comparisons, reviews and deep dives work well because the audience has already arrived with a question in mind.

    Understanding Generational Behavior

    On top of platform behavior, there is also the question of who you are talking to in terms of age and life stage. Different generations were raised on different internet habits, and that shapes what feels natural to them.

    Gen Z

    Gen Z grew up with social media as their default search engine. Around 46 percent of them say they prefer social platforms over traditional search when looking things up, and about 77 percent use TikTok to discover new products. Many of them spend more than four hours a day on social apps.

    What they respond to is authenticity, community, fast answers and entertainment. Brands that want their attention need to lean into short form video, work with creators, use content made by real users, and build things that feel interactive rather than one way.

    Millennials

    Millennials are big users of social media too, with around 86 percent active on these platforms and an average of 8.4 accounts per person. About 56 percent say they buy things based on influencer recommendations, and 65 percent trust suggestions that come from friends.

    This group wants practical value. They want to trust the brand, they want convenience, and they want to feel like the people behind the brand know what they are talking about. Educational content, honest testimonials, real case studies and influencer partnerships all work well here.

    Gen X and Boomers

    These audiences value trust, familiarity, simplicity and reliability above almost everything else. They are not chasing trends, they are looking for something steady. Community focused content, regular engagement on Facebook, longer educational videos and genuine customer success stories tend to do well with this group.

    The Apollo.io Playbook

    For sales reps and founders, Apollo focuses on LinkedIn, TikTok and YouTube Shorts, with content built around growth hacks, tutorials and practical workflows people can use right away. For VPs of sales and other executives, the focus shifts to LinkedIn, review sites and more enterprise focused channels, with messaging centered on return on investment, consolidating tools and overall business outcomes.

    The product is the same. What changes is who is being spoken to, where they are being reached, and what kind of message actually matters to them.

    Why Posting Frequency Is Not the Real Problem

    A question that comes up again and again is how often a brand should be posting. Should it be daily, three times a week, once a day per platform?

    The honest answer is that frequency is the wrong starting point. The better question is what should be posted, where it should go, and who it is actually for. Posting seven times a week to an audience that does not care will almost always do worse than posting three times a week to people who are genuinely interested.

    Frequency still matters, but only after relevance, audience fit and content quality are in place. Without those, more posting just means more noise.

    Building an Audience-Platform Matrix

    One simple way to bring all of this together is to build a kind of matrix or map that connects audience to platform to content to goal. It does not need to be complicated, but it does need to be honest.

    Start by asking who your audience actually is. Are they Gen Z, Millennials, Gen X, professionals, everyday consumers, or decision makers inside companies?

    Next, ask where these people actually spend their time. Not where you assume they spend time, but where they really are based on what you can see in your own data.

    Then look at what kind of content they consume in those spaces. Are they watching videos, scrolling carousels, reading thought leadership posts, following tutorials, or hanging out in community groups?

    Finally, be clear about what action you actually want. Is this about awareness, engagement, getting leads, driving sales, or keeping existing customers around longer? Each of these goals might point you toward a different mix of platform and content.

    Why Most Brands Struggle

    Most brands are not failing because they are lazy. They are failing because they are working off assumptions instead of evidence.

    You hear things like, we should be on TikTok because everyone is talking about it, or LinkedIn is hot right now so let us double down there, or let us just post every single day and see what happens. None of these statements actually answer the real questions. Is our audience even there? Are they engaging when we show up? What kind of content is actually working for us right now?

    Without answers to those questions, a strategy is really just a guess dressed up as a plan.

    How Bluekona Helps

    This is exactly where Bluekona comes in, by turning those guesses into something you can actually see and act on.

    On the audience side, Bluekona helps you understand who is engaging with your content, what kind of content resonates with them, and how different audience segments are responding over time.

    On the platform side, it shows you where your engagement is actually strongest, how each platform is performing compared to the others, and how content effectiveness differs from one channel to the next.

    On the content side, it helps identify which content pillars are winning, what your audience seems to genuinely prefer, and what patterns keep showing up in the way people engage.

    Put together, this means that instead of guessing where to post, how often to post, or what to create next, you get a clearer, data backed direction to work from.

    “I am not here to tell you social media is hard. I am here to tell you that guessing is hard. The data was just sitting there the whole time.” – Delphi

    The Future of Social Media Strategy

    The brands that win going forward will be the ones that stop thinking platform first and start thinking audience first. Instead of asking which app to chase next, they will ask who they are actually trying to reach, what those people care about, where they spend their time, and how they like to take in information.

    Once those questions are answered honestly, the platform strategy almost builds itself. The platforms are just the rooms. The real work is understanding the people inside them, and that is the shift that separates brands that get noticed from brands that get scrolled past.

    Frequently Asked Questions

    Does every business need to be on every social media platform?
    No. It makes more sense to focus on the platforms where your target audience is actually active and engaged, rather than trying to be everywhere at once.

    How do I know which platform is best for my audience?
    Look at audience demographics, content preferences and engagement patterns instead of just following whatever platform is trending at the moment.

    Is posting more often always better?
    Not really. Consistent, good quality content aimed at the right audience usually does better than high volume posting aimed at nobody in particular.

    Should B2B and B2C brands use different social media strategies?
    Yes. While some basic principles overlap, audience behavior, content formats and buying journeys tend to look quite different between the two.

    How can Bluekona improve audience targeting?
    Bluekona helps identify audience segments, content performance patterns and platform specific opportunities using real engagement and behavioral data, so decisions are based on what is actually happening rather than assumptions.

  • How to Create Reels People Actually Share

    How to Create Reels People Actually Share

    Most creators chase views. The ones who actually grow understand something different. The real question is not whether people will watch your Reel. It is whether someone will think of a specific friend while watching it.

    Some Reels get thousands of views and then disappear. Others keep showing up in group chats, DMs, and Slack channels for weeks. The difference is not production quality. It is not the trending audio. It is not even the caption.

    It is whether the person watching it immediately thought of someone else.

    The Hidden Distribution Channel Most Creators Ignore

    Most engagement on Instagram stays on Instagram. Likes stack up on your post. Comments sit below the video. Even saves live inside the app, visible only to you in your analytics.

    But when someone forwards your Reel, something different happens. That piece of content moves from the feed into a person’s DM with someone they actually know. It travels from your account into a private conversation between two real people.

    The algorithm can push content to more screens. But only people can push content into relationships.

    πŸ‘ Likes Stay on the platform. Only you see the count.
    πŸ’¬ Comments Stay on the platform. Public but passive.
    ✈️ Forwards Move between people. Person to person distribution.

    And most creators never even think about designing for forwards. They are optimizing for the algorithm while ignoring the far more powerful distribution channel sitting right there.

    The Five Types of Reels That Get Shared

    There are patterns to what people forward. Once you see them, you start noticing them everywhere. Here are the five types of Reels that consistently travel through DMs.

    Relatability Reels

    “The freelancer checking their bank account every hour after sending an invoice.”

    Person-Type Reels

    “Every marketing team has this one person.”

    Useful Shortcut Reels

    “Three hooks that consistently increase watch time.”

    Contrarian Reels

    “Posting more is not always the answer.”

    Conversation Reels

    “Most brands are posting way too much content.”

    Relatability Reels work because they describe a feeling so accurately that the person watching thinks, “I need to send this to the four other people who understand this.” Person-Type Reels work because they make someone instantly picture someone they know.

    Useful Shortcut Reels travel when they answer something a friend has been asking about. Contrarian Reels spark the forward because sharing a hot take is a way of starting a conversation. Conversation Reels are practically designed to be debated in DMs.

    Why Broad Content Rarely Gets Shared

    Generic content creates a weak emotional response. When a Reel is aimed at everyone, it connects with no one deeply enough to make them pick up their phone and send it to a person they actually know.

    Look at the difference between these two ideas for a Reel:

    Too broad

    “How to grow on Instagram.”

    Shareable

    “The creator spending five hours editing every Reel and wondering why growth still feels impossible.”

    The first one is information. The second one is recognition. Recognition is what gets forwarded.

    Specificity is not about narrowing your audience. It is about creating a strong enough signal that the right people feel seen. And when people feel deeply seen, they want to share that feeling with someone else.

    A broad Reel gets a like. A specific Reel gets sent to a friend with three crying laughing emojis and a “this is literally us.”

    A Better Question to Ask Before Posting

    Most creators run through the same checklist before posting. Is this valuable? Is it educational? Does it fit the brand? Is the caption good? Is the thumbnail working?

    All of those questions are fine. But there is one question that cuts through all of them and tells you almost immediately whether your Reel has share potential.

    The one question to ask before every post

    Can someone instantly think of one specific person they would send this to?

    If the answer is yes, your Reel has something working in its favour that no algorithm can replicate. It has a reason to travel.

    If the answer is no, it does not mean the content is bad. It might still get views. But it probably will not go anywhere on its own. It will sit on the feed, collect some passive engagement, and stop there.

    Content that cannot answer the “who would send this” question is usually too broad, too safe, too general, or too focused on what the creator wants to say rather than what the audience needs to feel.

    Stop Measuring Only Visibility

    The best Reels do not feel like content. They feel like something someone needed to say, and you happened to say it first.

    Before you post your next Reel, imagine it landing in someone’s DM inbox. Picture the person receiving it. Picture what the sender typed above it when they forwarded it.

    If you can see that moment clearly, your Reel has a real chance of going somewhere. If you cannot, it might be worth asking what needs to change to get there.

    Forwards are not a metric you can buy or boost. They are a sign that your content made someone feel something strong enough to share it with another human being. That is rarer than most creators think, and far more valuable than most platforms let on.

    See how Bluekona AI helps creators build content that people actually forward β€” not just scroll past.

  • What Is The New Currency of Social Media?

    What Is The New Currency of Social Media?

    Something has shifted. You have probably felt it, even if you could not name it. A creator with 18,000 followers drops a video and the comment section explodes. A brand with two million followers posts something and it lands with a quiet thud. Crickets.

    People scroll faster than ever. Watch time is shrinking. Audiences consume content in bursts, fragments, and stolen moments. And yet, somehow, they are leaving more comments, saving more posts, sharing more things, and sliding into more DMs than ever before.

    This is not a contradiction. This is the new reality of social media.

    The platforms that are winning right now are not rewarding the people who get seen the most. They are rewarding the people who get responded to the most. The game has changed, and most brands are still playing by the old rules.

    Social media used to reward visibility. Now it rewards participation. And those are very different things.

    Why Follower Count Is Losing Its Meaning

    There was a time when follower count meant everything. It made sense. Feeds were chronological, so if you had a big audience, your posts reached them directly. You owned your audience the way a newspaper owned its subscribers. More followers meant more reach, full stop.

    That world is gone.

    Today, algorithms decide what gets seen. Not subscriber lists. Not follower counts. Algorithms look at engagement signals: how quickly people respond, how deep the conversations go, how often the same people keep coming back. A creator with 20,000 genuinely active followers can outperform one with two million passive ones because their content triggers real behavior.

    Follower count now tells you one thing: how many people once clicked a button. It does not tell you how many people trust the creator, remember their content, buy what they recommend, or care enough to come back. It is a headcount, not a relationship measure.

    20K Active followers can beat 2M passive ones in reach
    3x Engagement weight algorithms give comments over views
    80% Of buying decisions happen after social interaction, not just viewing

    The brands that have figured this out are not chasing follower counts anymore. They are chasing conversations. And there is a big, important difference between the two.

    Comments Are Becoming Their Own Culture

    Spend five minutes in a popular TikTok comment section and you will understand. The comments are not just reactions to the video. They are their own show. People are riffing off each other, building inside jokes, starting debates, doing bits. The original content becomes the stage and the comment section becomes the actual performance.

    This is not a quirk. This is a fundamental shift in how people use social platforms.

    On LinkedIn, a single provocative post can trigger a thread that runs for days. People who never watched the original video jump in because the debate is where the action is. On Instagram, meme replies and callback jokes in the comments get more engagement than the post itself. On YouTube, entire communities form inside the threads of certain channels, with regulars who know each other, reference past conversations, and build a shared culture that lives in the replies.

    Why do people love comments so much? Because they offer something that passive content never can: a way to be seen. When you drop a funny comment and people like it, you get a small but real moment of belonging. You signaled your humor, your worldview, your membership in the culture. That is deeply human. And it is now a core feature of how social media works.

    Comments are not just reactions anymore. They are entertainment layers, mini communities, algorithmic fuel, and increasingly, they are the reason people show up at all.

    Why View Time Is Falling but Engagement Is Rising

    Here is the part that confuses a lot of marketers. If people are scrolling faster and watching less, how is engagement going up? Should not the two move together?

    Not anymore.

    Modern users do not consume content the way they used to. They do not sit down and watch a 10-minute video from start to finish. They see a clip, catch the gist, jump to the comments, watch 40 seconds, get pulled into a thread, share a screenshot to a friend, come back three hours later to check replies. Their attention is fragmented, but their participation is real and it is active.

    Attention is not disappearing.
    It is fragmenting.

    What this means practically is that average view duration is a weaker signal than it used to be. Someone who watches 12 seconds of your video, laughs, and sends it to four people is more valuable than someone who watches the whole thing and scrolls past. The first person participated. The second one consumed.

    Platforms have figured this out. The algorithm is no longer just looking at watch time. It is looking at what happens around the content. Did people react? Did they comment? Did they save it? Did they come back? Did the same people engage twice? These signals carry more weight than raw view counts, and they are reshaping what it means to have good content.

    Social Media Is Becoming Participation Media

    Let us name what is actually happening here. Social media is not really social media anymore in the old sense. It is not a broadcasting platform where creators publish and audiences watch. It is a participation platform where the content is just the opening move in a much bigger conversation.

    Old Social Media
    • βœ•Broadcasting content outward
    • βœ•Creator-centric model
    • βœ•Passive audiences watching
    • βœ•Follower count = power
    • βœ•Views are the win
    • βœ•One-way communication
    New Social Media
    • βœ“Conversations and participation
    • βœ“Community-centric model
    • βœ“Active audiences responding
    • βœ“Engagement depth = power
    • βœ“Recurring interaction is the win
    • βœ“Two-way and multi-way dialogue

    The features that platforms are building tell the whole story. Stitches, duets, reaction videos, collaborative posts, comment-pinning, reply threads, DM links from posts: all of these are participation tools, not broadcasting tools. They are built to pull the audience into the content, not just in front of it.

    The brands winning on social right now treat every post as an invitation. An invitation to respond, to share an opinion, to join a joke, to start something. Not a billboard. An opening line.

    The Rise of Engineered Engagement

    Here is where things get interesting, and a little bit clever. Creators and marketers have started to realize that participation can be designed. You do not have to wait and hope people comment. You can build systems that make it almost inevitable.

    You have probably seen this everywhere by now. “Comment GUIDE below and I’ll DM you the full resource.” “Type TEMPLATE and I’ll send it straight to your inbox.” “Reply PART 2 if you want me to continue this.” These are not accidents. They are engineered participation loops, and they work.

    A comment today is often more valuable than a passive view. It signals intent, emotional response, participation, and algorithmic relevance, all at once.

    Tools like ManyChat have made this systematic. Someone comments a keyword, an automated DM fires, a funnel begins. The comment triggers distribution. The comment triggers lead generation. The comment triggers a conversation that might end in a sale. One action, multiple outcomes.

    This is not manipulation. It is smart design. It meets people where they already are, in the comment section, doing what they already want to do, and it turns that behavior into something useful. For the creator and for the audience.

    The Problem With Modern Engagement Loops

    But here is the honest part. Not everything about engineered engagement is good.

    When every creator is doing “comment PART 2,” the comment section starts to feel like a vending machine. Transactional. Hollow. People comment the keyword because they want the thing, not because they actually care. The conversation looks real on the surface, but there is no genuine exchange happening underneath.

    Fake urgency has become a plague. “Last 24 hours to get this.” “Only 3 spots left.” “You need to see this before it’s gone.” When everyone uses the same tricks, the tricks stop working. And worse, they start to erode trust.

    The brands that are going to win long-term are not the most automated. They are the ones that combine scalable systems with genuine interaction. They use the tools to handle volume, but they show up personally when it matters. They respond to comments like humans, not robots. They build systems that serve real relationships, not systems that simulate them.

    Automation is a multiplier. But you have to start with something worth multiplying.

    What Brands Are Still Measuring Wrong

    Most brand social media reports still look the same. Impressions this month. Follower growth. Reach. Views. Maybe engagement rate as a percentage.

    These numbers feel safe because they are easy to explain. “We reached 400,000 people this month.” Great. But did any of them care? Did any of them come back? Did a single one of them feel like they were part of something?

    The old metrics were built for broadcasting. Count how many people you reached. The new metrics need to be built for participation. Measure how many people responded, returned, and brought their friends.

    Reach without participation has limited value. You can pay for reach. You can buy impressions. What you cannot buy is a community of people who genuinely give a damn about what you do.

    The New Metrics That Actually Matter

    So what should you be measuring instead? Here are the signals that tell you whether your social presence is actually building something.

    πŸ’¬ Comment depth Conversation quality
    πŸ” Repeat commenters Returning voices
    πŸ”– Save behavior Intentional interest
    πŸ’Œ DM conversions Relationship signals
    πŸ“ˆ Engagement velocity How fast response grows
    🎯 Sentiment quality What people feel

    Repeat commenters tell you that someone is coming back because they want to be part of what you are building, not just because an algorithm served your post. Save behavior tells you that someone valued your content enough to want it again later. DM conversions tell you that a public interaction turned into a private relationship, which is where trust really lives.

    Engagement velocity tells you whether your content is sparking something that compounds. A post that gets 50 comments in an hour and then builds to 300 over three days is a very different beast from a post that gets 300 comments once and goes silent. The first one has momentum. The second one is just a spike.

    These are participation signals. And they are the most honest picture of whether your social presence is actually working.

    Where Bluekona Fits Into All of This

    This is exactly the problem Bluekona was built to solve. Not just what gets seen, but what actually creates participation and builds community momentum over time.

    Detects meaningful engagement patterns

    Identifies what sparks real discussion, what creates recurring interaction, and what your audience emotionally responds to.

    Tracks participation beyond vanity metrics

    Measures comment behavior, engagement depth, audience return patterns, and participation consistency over time.

    Finds your compounding content

    Shows which themes build communities, which formats sustain interaction, and what creates recall instead of a one-time spike.

    Answers the questions that matter

    Not just “how many views did this get?” but did people care, did they participate, did conversations continue, did the community strengthen?

    Why Viral Reach Is Becoming Less Valuable

    Here is a slightly uncomfortable truth that the industry does not talk about enough. Going viral is not what it used to be. Ten years ago, viral meant something. It meant your content broke through, that millions of people chose to share it, that you had captured something real about a cultural moment.

    Today, viral can mean an algorithm pushed your content to a cold audience who scrolled past it in 2 seconds, boosted by a spike of passive eyeballs that evaporated the next morning and left nothing behind. No new followers. No conversation. No community. No recall.

    Visibility without participation is increasingly hollow. You can have a post that reaches 5 million people and builds less lasting value than one that reaches 50,000 people who feel genuinely connected to what you do.

    The brands that understand this are shifting their goal. Not just: reach as many people as possible. But: reach the right people, and give them a reason to respond, return, and recruit others. That is a compounding strategy. That is how communities actually form.

    What This Means for You Right Now

    If you take one thing from all of this, let it be this: the social media game has moved. The old scorecard is broken. Follower counts, raw views, and passive impressions are not the full story anymore, and optimizing for them alone is increasingly a path to spinning your wheels without going anywhere.

    The new game is participation. It is about creating content that people feel compelled to respond to. It is about building systems that turn responses into relationships. It is about measuring the things that actually compound over time, repeat visitors, deep conversations, saves, DMs, community momentum.

    This does not mean you stop caring about reach. Reach still matters. But reach is the starting point, not the finish line. What you do with that reach, how you turn passive eyeballs into active participants, that is where the real value is built.

    The brands that figure this out now will have an enormous head start. Because right now, most of their competitors are still chasing the old numbers. And while they are busy counting followers, the smart brands are building communities that will still be showing up three years from now.

    Stop measuring only visibility

    Understand what actually drives participation. Build communities, not vanity metrics. Measure what compounds.